|

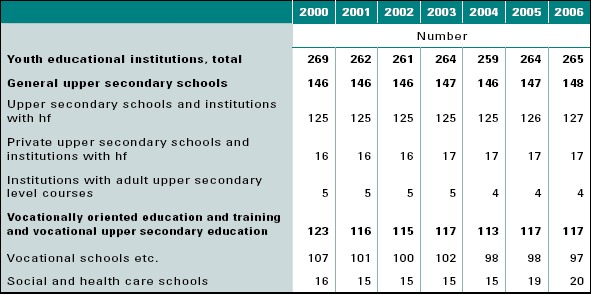
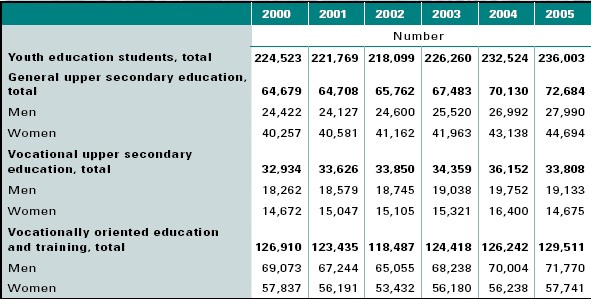
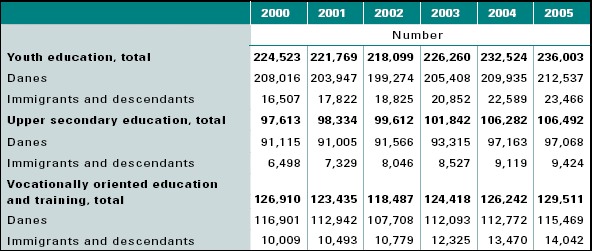
5 Youth education5.1 Number of schools and studentsToday, 81 % of a youth cohort receive a youth education. It is the governments goal that 95 % of a youth cohort receive a youth education in 2015. The youth education programmes comprise the higher education preparatory general upper secondary studies and the vocational education and training programmes that target the labour market, but which may also give admission to higher education. In total, in 2006, there were 148 general upper secondary educational institutions in the country. 117 schools offered vocationally oriented education and training programmes and vocational upper secondary education programmes. The vocational schools have many local branches so that youth education is available all over the country (table 5.1). From table 5.2 it may be seen how many students have been enrolled in a youth education in the years 2000 through 2005, and how they are distributed by gender. In 2005, 236,000 students were enrolled in a youth education. Of these, 106,500, equivalent to 45 %, were enrolled in an upper secondary education programme, and 129,500, equivalent to 55 %, were enrolled in a vocationally oriented education and training programme. Table 5.1. Number of educational institutions with youth education programmes
Table 5.2. Number of students in youth education by gender
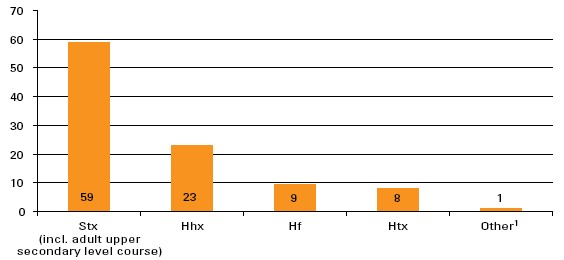
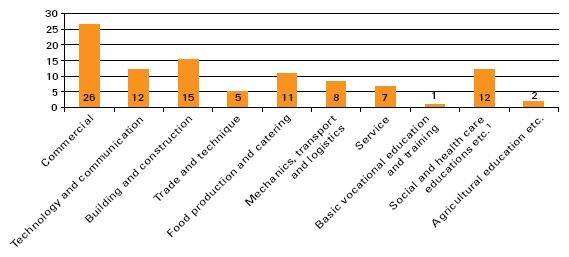
In 2005, there were 72,700 students in the general upper secondary education programmes comprised of the upper secondary school leaving examination (stx) and the higher preparatory exams (hf ). The majority by far (86 %) of these chose stx, while 14 % preferred hf. The vocational upper secondary education programmes, consisting of the higher commercial examination (hhx) and the higher technical examination (htx), accounted for 33,800 students in 2005. The greater part (72 %) took hhx, while a good fourth studied for htx. The drop in number of students from 2004 to 2005 was caused by the closing down of the one-year hhx. In the general upper secondary education programmes, there are markedly more women than men, whereas there is a predominance of men in the vocational upper secondary education programmes and especially in the vocationally oriented education and training programmes. Figure 5.1 shows the distribution of students in the upper secondary education programmes in 2005. In 2005, most of the general upper secondary students were enrolled in stx (59 %). Hhx followed with 23 % of the students. Htx had a share of 8 % of the students, while the two-year hf had 9 %. In 2005, 129,500 students studied in a vocationally oriented education and training programme. Among the vocationally oriented education and training programmes, the following in particular are popular: the commercial education programmes, building and construction programmes, social and health care training programmes, and technology and communication programmes (figure 5.2). Figure 5.1. Distribution of students in upper secondary youth education per education programme, 2005, percent
Figure 5.2. Distribution of students in vocationally oriented education and training by education programme, 2005, percent
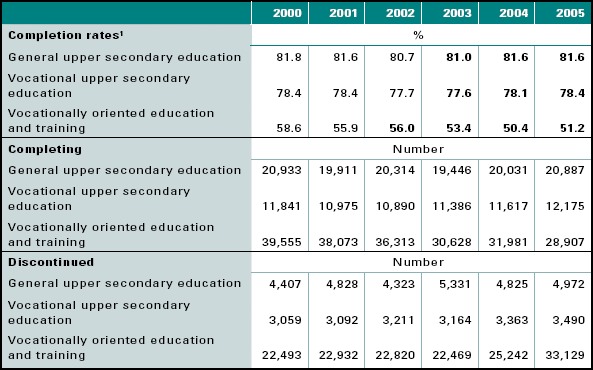
When starting the stx programme, the students are 16.5 years old in average, while in hhx and htx they are approximately 17 years old. When graduating stx, the students are 19.5 years old in average and around 20 years old when graduating hhx or htx. In the stx, hhx, and htx programmes, the students have the same age, whereas there is a wider variation in the age of the students in the two-year hf programme, which also caters to adults. In average, the students in the hf programme are 19 years old when they start, while their average age is 20.5 when they complete (does not emerge from the figure). The average age when completing is only 1.5 years higher than when starting the two-year education programme because the younger age groups are better at completing than the older ones. In the vocational education and training programmes, the students are almost 21 years of age when they start the basic course of study, and when they start the main course, they are nearly 26 years old since some of them do not come directly from a basic course. When they complete their education, they are 28 years old in average. Most of them are under 25 years old when they complete their vocational education and training programme but the variation in age is very wide in the vocational education and training programmes. For example, students within the social and health care system are almost 34 years old in average when they graduate. These education programmes as well as other vocationally oriented education and training programmes are widely used to upgrade the qualifications of the labour force, for example via adult apprentice schemes. 5.2 Completion, dropout, and behaviour after dropoutIn the upper secondary education, the greater part of the students completes the programme, whereas only a good half of the students in vocationally oriented education and training complete a programme The completion rate is a measure of the proportion of students who have started an education programme the year in question, and who finish that programme. Eight of ten students are expected to complete their education in the upper secondary programmes. There is, however, a large variation. With 84 %, stx has the highest completion rate. Then hhx follows with 80 %, htx with 71 %, and hf with 66 %. In 2005, 33,100 students graduated (table 5.3). The vocationally oriented education and training programmes typically start with a basic course of study of 20 to 60 weeks duration. Approximately 70 % of the students complete the basic course of study that they started. Unless they already have one, the students then need a practice placement so they can continue with the main course of study and complete the education. Otherwise, in some of the programmes, the students may continue in school practice. The main course of study takes approximately three years and 80 % complete their main course (ref. section 5.5). Only a good half (51 %) of those who start a vocationally oriented education and training programme are expected to complete it. This is owed to circumstances such as not all students obtaining a practice placement, some students changing to another education en route, and still others dropping out. During the period from 2000 to 2005, the number of students completing a vocational education and training programme dropped from nearly 39,600 to 28,900. This was caused by a decreasing number of students in the year groups, a higher dropout rate, and more students choosing an upper secondary programme. As mentioned in the previous section, the compositions of the student groups in upper secondary education and vocationally oriented education and training programmes are different, which should be taken into consideration when comparing the completion rates. Table 5.3. Completion rates, number of students who complete an education, and number of students who drop out on the way
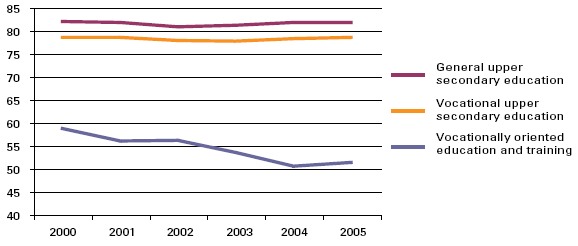
Figure 5.3. Completion rates in youth education programmes
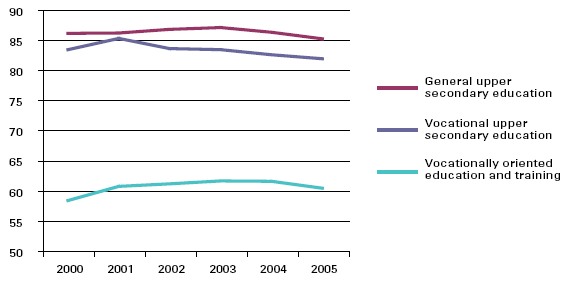
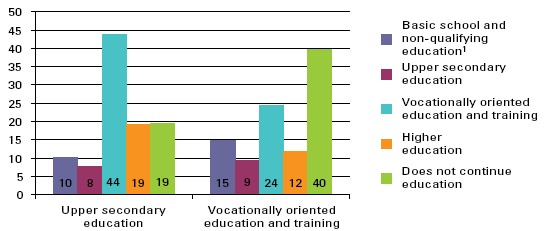
The major part of the students dropping out of an upper secondary education are expected to start a new education. The major part (82 %) of those dropping out of the general upper secondary education are expected to start another youth education. The same is expected as regards 85 % of those dropping out of a vocational upper secondary education. Of those dropping out of a vocationally oriented education and training programme, only 60 % are expected to start another education (figure 5.4). Since 2001, the tendency to continue the education has been decreasing slightly in general upper secondary education. In vocational upper secondary education and in vocationally oriented education and training, the trend has likewise been falling since the year 2003. 44 % of those dropping out of an upper secondary education are expected to start a vocationally oriented education and training programme within ten years, whereas 19 % are expected to start a higher education4. 8 % are expected to start a new upper secondary course of education (figure 5.5). 24 % of the students who drop out of a vocationally oriented education and training programme are expected to start a new vocationally oriented education and training programme while 12 % are expected to start a higher education. A proportion of 9 % is expected to start an upper secondary education programme. 40 % do not continue in education within ten years. Figure 5.4. Behaviour after discontinued youth education proportion expected to start another education within ten years
Figure 5.5. Behaviour after discontinued youth education proportion expected to start another education within ten years, 2005
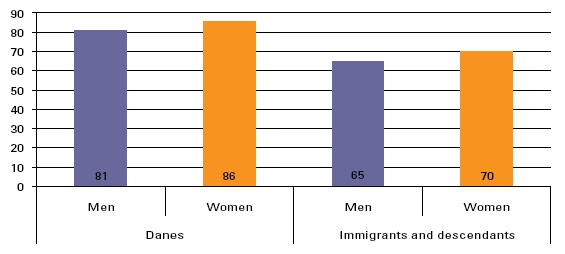
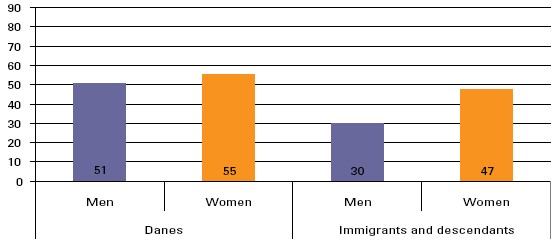
5.3 Immigrants and descendantsFrom 2000 to 2005, the proportion of immigrants and descendants in youth education has increased steadily. In 2005, the proportion of immigrants and descendants completing an education was generally lower than the proportion of ethnic Danes. Irrespective of ethnicity, the women are better at completing than the men are. In 2005, one in ten students in youth education had an ethnic background other than Danish. In total, there were 23,500 immigrants and descendants with 9,500 in an upper secondary education where they made up 9 % of the students, and 14,000 in a vocationally oriented education and training programme where they made up 11 % of the students (table 5.4). In the upper secondary education programmes as well as in the vocationally oriented education and training programmes, the number of immigrants and descendants has increased. In 2000, the number of immigrants and descendants in upper secondary education was 6,500, corresponding to 7 %, and 10,000 in the vocationally oriented education and training programmes, corresponding to 8 %. There is a more even gender distribution in youth education among immigrants and descendants than there is among ethnic Danes. In upper secondary education, the women made up 54 % in 2005, while there were largely the same number of men and women in the vocational education and training programmes. In upper secondary education, the women chiefly chose the general programme, whereas the men largely choose a vocational programme. In the vocationally oriented education and training programmes, the men choose a technical education, whereas the women especially choose a social and health care education (does not emerge from the table). The completion rate is a measure of the proportion of students who have started an education programme the year in question, and who finish that programme. The completion rate is a measure of the proportion of students who have started an education programme the year in question, and who finish that programme. Only 39 %, of the immigrants and descendants who start a vocationally oriented education and training programme are expected to complete it. When comparing the completion rates for ethnic Danes with the completion rates for immigrants and descendants in the upper secondary education programmes, the ethnic Danes in general, have a higher completion rate. In the upper secondary education programmes, nearly 86 % of the Danish women are expected to complete in contrast to 70 % of the women among immigrants and descendants. For the men, the corresponding figures are 81 % for Danish men and 65 % for men among immigrants and descendants (figure 5.6). The same pattern is observed in the vocationally oriented education and training programmes as in upper secondary education. In general, the ethnic Danes have a higher completion rate than immigrants and descendants, while the women likewise have a generally higher completion rate than the men. Among the women, 47 % are expected to complete a vocationally oriented education and training programme in contrast to only 30 % of the men (figure 5.7). Besides, women in general being better at completing, the very large difference may also be a consequence of the women primarily choosing the significantly shorter social and health care education programmes. Table 5.4. Number of students in youth education by ethnic background
Table 5.5. Completion rates, immigrants and descendants
Figure 5.6. Completion rates in upper secondary education by ethnicity and gender, 2005
Figure 5.7. Completion rates in vocationally oriented education and training by ethnicity and gender, 2005
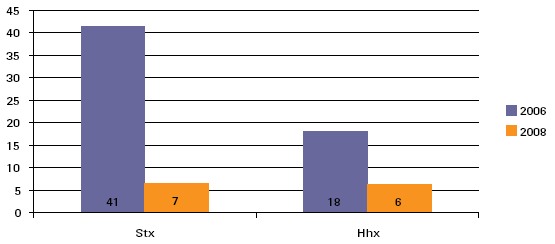
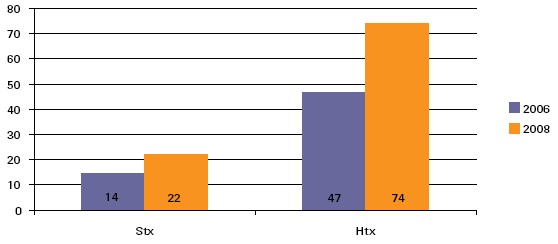
5.4 Choice of subjects in upper secondary schoolsThe upper secondary education programme has undergone a reform that has strengthened the natural science subjects. Consequently, after the reform, more students will be qualified to apply to an education within natural sciences, technology, and health. Conversely, a smaller proportion of the future higher education students will master three or more foreign languages as compared to the situation before the reform. Upper secondary education has undergone a major reform that has influenced the structure and contents of the education programmes. The three upper secondary education programmes: Upper secondary school leaving examination (stx), higher commercial examination (hhx), and higher technical examination (htx) have been given a common structure with an introductory foundation course of study with a duration of half a year and a subsequent major line of study with a duration of two and a half years. Each education programme has major subjects, mandatory subjects and electives. In upper secondary schools, the subjects may be taken at A, B, or C level respectively, A being the highest level. The first year group to start in the new reform began their education in 2005, and they will complete it in 2008. As purposed, the reform has strengthened the natural sciences with the future graduates. Furthermore, the future graduates will have fewer foreign languages, but the ones they do have will be completed at a higher level. In stx, the proportion of students with three foreign languages was 41 % before the reform. After the reform, this proportion is expected to be less than 7 % (figure 5.8). The proportion of students in hhx who had at least three foreign languages before the reform was 18 %. After the reform, this proportion is expected to drop to 6 %. Thus, there will be a drop of 12 percentage points from 2006 to 2008. Since htx is a technical upper secondary education, no students in this programme take three foreign languages neither before nor after the reform. An important goal of the reform is to increase the proportion of graduates who meet the requirements for admission to an education programme within natural sciences, technology, and health. This requires that the students have taken mathematics at level A, and physics and chemistry at least at level B. Only graduates from stx and htx will have the opportunity to meet these requirements. In 2006, the proportion of graduates with mathematics A and physics and chemistry at least at level B was 14 % for stx, while the corresponding proportion after the reform in 2008 is expected to be 22 %, and thus 8 percentage points higher than in 2006 (figure 5.9). In the htx programme in 2006, nearly half of the graduates had taken mathematics at level A and physics and chemistry at least at level B. After the reform, barely 74 % are expected to take these subjects and levels. Thus, here we have an increase just short of 28 percentage points. Figure 5.8. Proportion of students in 2006 and anticipated proportion of students in 2008 with at least three foreign languages in stx and hhx
Figure 5.9. Percentage of students in 2006 and anticipated number of students in 2008 who take mathematics A and physics and chemistry at minimum level B in stx and htx
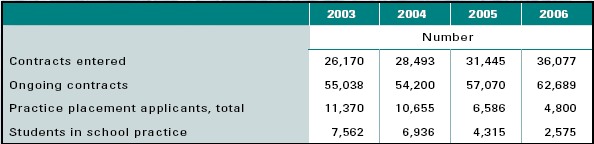
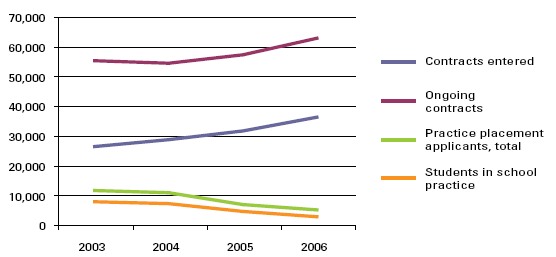
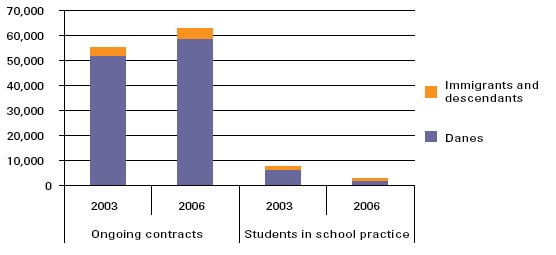
5.5 Vocational education and training practice placementsThe number of contracted practice placements has increased markedly from 2003 to 2006. During the same period, the number of practice placement applicants and students in school practice has fallen considerably. The vocational education and training programmes (EUD) are alternating programmes where parts of the training takes place in a school, while other parts take place in practice. Therefore, the students should apply for a practice placement and enter a contract about a practice placement with an enterprise. Students who cannot find a practice placement themselves may take their practice in school. During recent years, the number of contracted practice placements has increased markedly. During 2006, nearly 36,100 contracts were entered an increase of 38 % compared to 2003 where slightly less than 26,200 contracts were entered (table 5.6). Contracts entered refer to the number of students who have contracted a practice placement during the year. Ongoing contracts refer to the number of students who are placed in practice with a contract. Students in school practice refer to the number of students who are in school practice at the end of December. Total number of practice placement applicants includes students without an ongoing or planned contract who have qualified for the desired main course of study, and who have confirmed their application. Students in school practice do not have a contract, and therefore they count as placement applicants. By end December 2006, 4,800 students were applying for a practice placement, a drop of 58 % compared to 2003 where there were 11,400 applicants. In part, the drop may be attributed to a change in requirements to the students status as applicants. Improved opportunities for obtaining a practice placement, however, have also contributed to the decrease. In 2006, there were 62,700 students with a contract. From 2003 to 2004, the number dropped from 55,000 to 54,200; however, since 2004 there has been a steady increase in the number. There has been a significant drop in the number of students in school practice. Thus, from 2003 to 2006, the number decreased by 66 %, and in 2006, there were slightly less than 2,600 students in school practice. The significant decrease in number of students in school practice is owed to improved opportunities to obtain a practice placement as well as the introduction of restricted admission to school practice in eight of the education programmes. These eight programmes are: information technology and communication, office with special subject, technical designer, mechanic, electronics and low power, electrician, carpentry, and cabinet making. The restriction of admission to school practice for these education programmes is specific to the programme. Formerly, in the case of some education programmes, the enterprises, rather than undertaking a training contract, let the students take school practice. In other cases, a low employment rate for skilled persons in school practice was a decisive factor. Figure 5.10 shows the development in number of practice placement applicants for the period 2003 through 2006. Figure 5.11 shows ongoing contracts and students in school practice by ethnicity. In 2006, a significantly larger number of Danes as well as immigrants and descendants had an ongoing contract as compared to 2003. Especially the immigrants and the descendants have benefited from the higher number of contracts. The proportion of Danes with a contract has increased by 13 %, whereas the proportion of immigrants and descendants has increased by 33 %. In 2006, fewer students were undertaking school practice compared to 2003. For the group of Danes, the number of students in school practice has decreased by 69 %, while the decrease is 52 % for the group of immigrants and descendants. Since the drop has been less for immigrants and descendants than for Danes, the former constituted a larger proportion of students in school practice in 2006 than in 2003. In 2006, immigrants and descendants made up 25 % of all students in school practice as opposed to 17 % in 2003. Table 5.6. Practice placement applicants and contracts at the end of December
Figure 5.10. Practice placement applicants and contracts at the end of December
Figure 5.11. Ongoing contracts and students in school practice at the end of December by ethnicity, 2003 and 2006
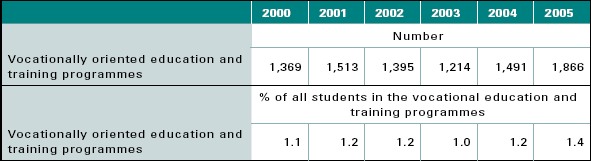
5.6 International mobilityIn 2005, 1.4 % of all students in vocational education and training programmes have had practice abroad. Supported by either the Danish practice scheme, Practice Abroad (PIU), EUs Life Long Learning Programmes (Leonardo da Vinci, Comenius), the DK-USA programme, or the Nordic Nordplus programme, students in the vocationally oriented education and training programmes may complete a part of their education at schools or in practice abroad. Typically, the exchange programmes last from one to nine months and give credits. That is to say that the time abroad is credited in the Danish vocational education and training programme. The number of Danish students in the vocationally oriented education and training programmes who complete a practice placement abroad increased from 1,369 in 2000 to 1,866 in 2005. The increase came primarily from students in practice abroad under the Danish PIU scheme and from EUD students in practice and study visits abroad through the EU programme Leonardo da Vinci. Young Danish people are especially attracted to Norway, Great Britain, Germany, and Sweden. These four countries account for a total share of 72 %. Table 5.7. Students in vocationally oriented education and training programmes who complete a practice placement abroad
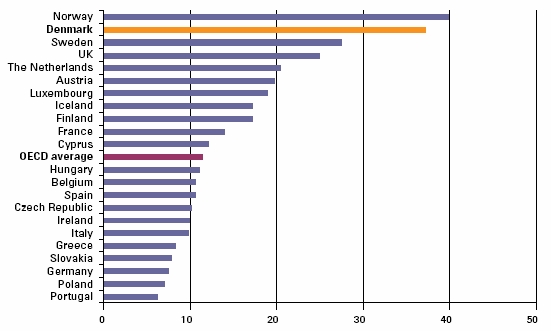
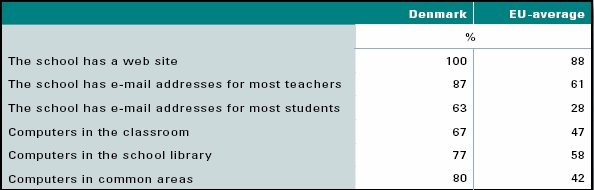
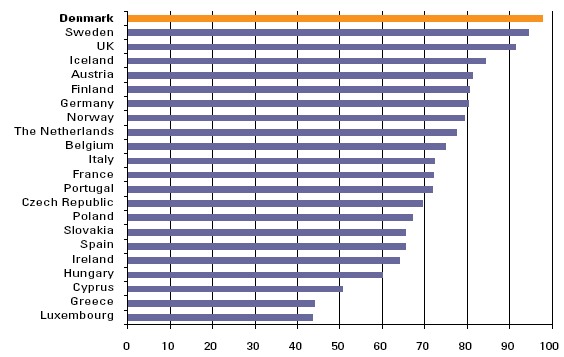
5.7 Key figures for use of computers in Denmark and selected countriesAs it is the case for the basic school, Denmark tops in the use of computers in upper secondary youth education. There are many computers in youth education, and they are used for teaching. In 2006, there were 37 computers with Internet access per 100 students in upper secondary education. Only Norway exceeded this number with 40 computers with Internet access per 100 students. Immediately hereafter, countries that Denmark normally compares with follow, namely Sweden and UK with 28, respectively 25 computers with Internet access per 100 students. In 2006, all youth educational institutions in Denmark had a web site, while the average in EU was 88 %. Additionally, 87 % of the schools in Denmark had e-mail addresses for most of the teachers, while 63 % of the schools had e-mail addresses for most of the students. This is 26, respectively 35 percentage points more than the average for youth educational institutions in EU (table 5.8). This places Denmark considerably over the EU average for some of the tools that among other things must be available in order to develop qualifications and knowledge within information technology. 67 % of the youth education schools in Denmark had computers in the classroom compared to an EU average of 47 %. It should be added that many Danish young people themselves bring a computer to school. In the Danish school libraries, there was at least one computer in 77 % of the youth educational institutions, which is 19 percentage points over the EU average. There is an even greater difference between the Danish and European/ EU standards as far as computers in the communal areas are concerned. In 2006, there were computers here in 80 % of the youth educational institutions in Denmark, whereas this was only the case for 42 % of the schools in EU. In the Danish youth education programmes, 98 % of the teachers had used computers in teaching last year. This places Denmark in the top among the countries in Europe. Then Sweden and UK follow where over 90 % of the teachers had used computers in classroom teaching within the last twelve months (figure 5.13). Figure 5.12. Number of teaching computers with Internet access per 100 students in upper secondary education, in Denmark and selected EU countries, 2006
Table 5.8. Key figures for information technology in upper secondary education, 2006
Figure 5.13. Proportion of teachers in upper secondary education who have used computers in teaching in the last 12 months in Denmark and selected EU countries, 2006
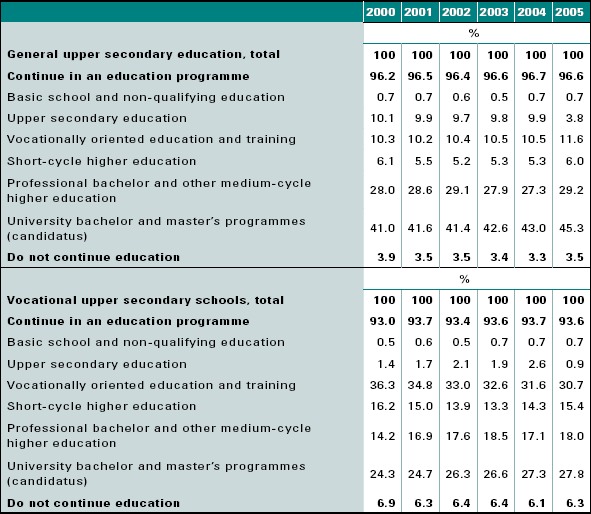
5.8 What do young people do after having completed a youth education programmePractically all students that complete their upper secondary education continue their education. This is also the case for a good fourth of the fully trained young people with a vocationally oriented education and training. An upper secondary education prepares for a higher education, whereas a vocationally oriented education and training is vocationally oriented. Thus, it is to be expected that the majority of the students who complete a higher secondary education continue their education. More precisely, 97 % of those who complete a general upper secondary education and 94 % of those who complete a vocational upper secondary education continue their education, whereas this is only the case for 28 % of those who complete a vocationally oriented education and training programme (table 5.9 and 5.10). Although upper secondary education primarily prepares for a higher academic education, 31 % of vocational upper secondary students are expected to continue in a vocationally oriented education and training programme. This is also the case for 12 % of the graduates from the general upper secondary schools (table 5.9). Eight out of ten who graduate from a general upper secondary school and a good six out of ten who complete a vocational upper secondary programme are expected to pursue a higher education. Especially the university bachelor education is popular among the general upper secondary graduates. In 2005, 45 % of the graduates from the general upper secondary schools started in university, whereas 29 % started a professional bachelor education, and 6 % started a shortcycle higher education. 28 % of the students in a vocational upper secondary programme are expected to continue in a university programme, 18 % in a professional bachelor programme, and 15 % in a short-cycle higher education programme. In 2000, one in ten graduates from a general upper secondary school continued in another upper secondary education programme. This proportion dropped to 4 % by 2005 where the one-year hhx, which could be taken on top of another upper secondary, was closed down. Thus, this option no longer exists. Table 5.9. Behaviour after completing upper secondary education proportion expected to begin further education within ten years
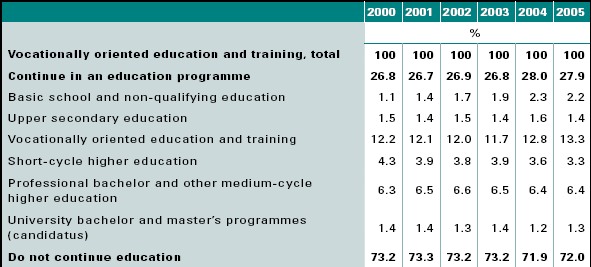
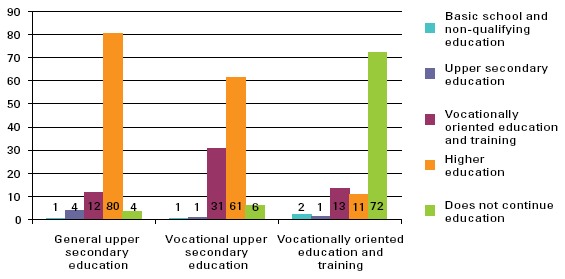
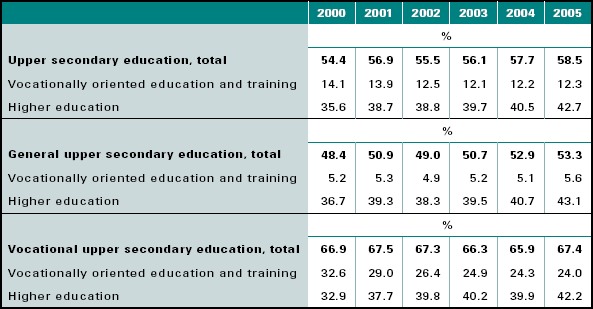
The majority by far (72 %) of those who complete a vocationally oriented education and training programme naturally leave the education system and become available to the labour market. Nearly 28 % will resume their education within the next ten years. In total, 13 % are expected to start another vocationally oriented education and training programme; while a good one in ten is expected to start a higher education. Table 5.10 shows that over time, there is only a modest fluctuation in the percentages Figure 5.14 shows which education students who graduate from the upper secondary schools and the vocational schools are expected to start within 10 years. Table 5.11 shows how many are in the course of another education programme 15 months after having graduated from an upper secondary school. More than half of the graduates are under way again after 15 months, corresponding to one year plus a summer holiday. The young people get started quickly. As shown, nearly 59 % were on the go after one year in 2005. This proportion has been increasing in recent years. In 2000, a good 54 % were on the way 15 months after graduating from a general upper secondary education. Especially in the higher education programmes, the young people get started faster. In 2005, nearly 43 % had started a higher education after 15 months as compared to close to 36 % in 2000. The vocational upper secondary graduates get started the fastest. A good 67 % start within 15 months compared to 53 % of the graduates from general upper secondary schools. Table 5.10. Behaviour after completing a vocational education and training programme proportion expected to begin further education within ten years
Figure 5.14. Behaviour after completed youth education proportion expected to start another education within ten years, 2005
Table 5.11. Percentage of students who 15 months after having graduated general upper secondary school have started further education
Footnotes4) They may be admitted on exemption or after having complemented with single subject hf classes.
|
||
|
To the top of the page |