|

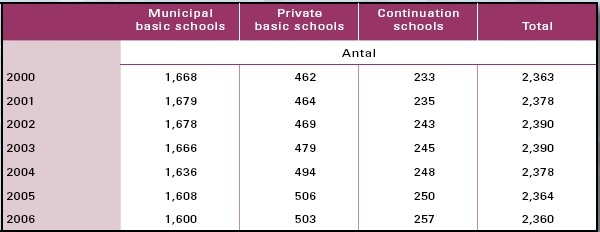
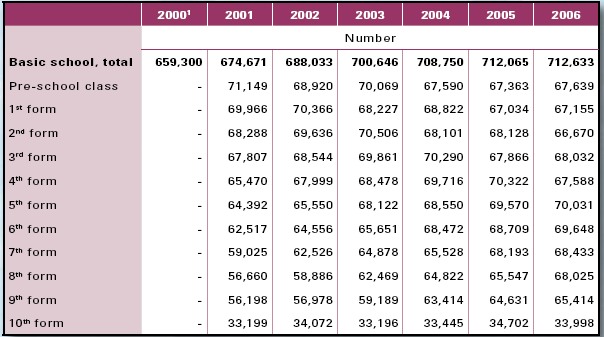
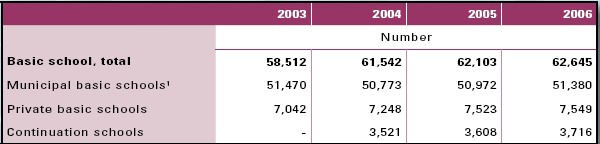
4 Basic school4.1 Number of schools and pupilsThe number of basic schools has decreased since 2000. At the same time, more pupils have come by. As a result, there are now more pupils in each school. In 2006, there were 2,360 basic schools comprised of 1,600 municipal basic schools, 503 private basic schools, and 257 continuation schools. Over the period as a whole, from the year 2000 through 2006, there have become fewer municipal schools, whereas the number of private basic schools and continuation schools has increased (table 4.1). Note that the year 2006 corresponds to the school year 2006/2007, just as 2000 corresponds to the school year 2000/2001. Additionally, there were 470 municipal youth schools, youth boarding schools, and special schools where teaching at the basic school level took place as well as 183 schools in connection with daytime therapy and therapeutic institutions. While the basic schools have become fewer, the number of pupils has increased steadily. From 2000 to 2006, the number of pupils in basic school increased from 659,300 to 712,600. This corresponds to an increase of 8 % (table 4.2). Table 4.1. Basic schools per type of school
Table 4.2. Number of pupils in basic school per form level
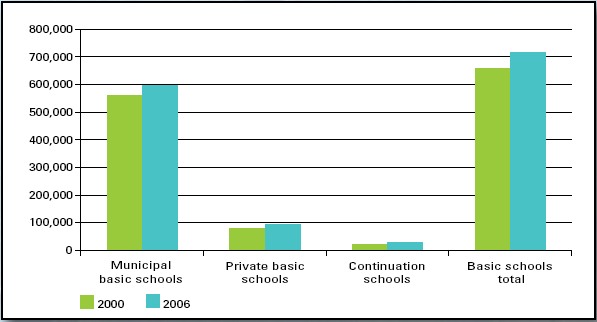
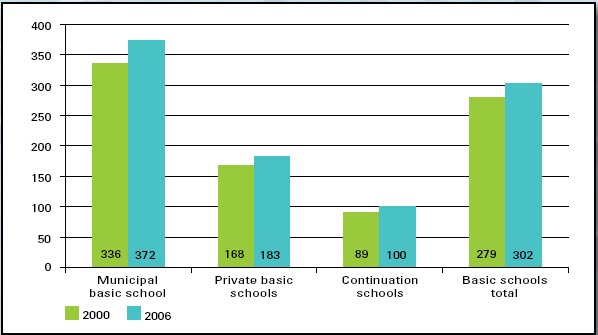
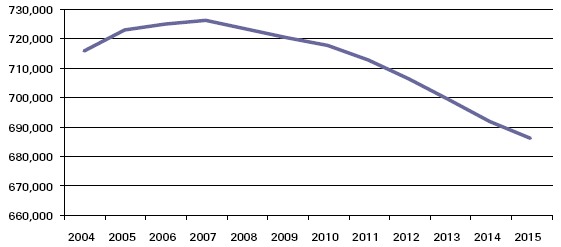
Figure 4.1 shows the number of pupils in basic school per type of school in 2000 and in 2006. Regardless of type of school, the number of pupils has increased. The continuation schools have 24 % more pupils, corresponding to an increase of 5,000 pupils, while the private basic schools have 19 % more pupils, corresponding to an increase of 14,500 pupils. In comparison, the municipal basic schools only have 6 % more pupils, although this represents an increase of 35,000 pupils. Fewer basic schools and more pupils have resulted in the average number of pupils per school having increased. As figure 4.2 shows, the largest numeric growth has taken place in the municipal schools that have experienced an increase of 36 pupils per school corresponding to 11 %. On the other hand, the continuation schools have had the highest increase by percent with 13 % more pupils per school (11 pupils). The anticipated development in number of pupils until 2015 is shown in the extrapolation in figure 4.3. It is seen that the number of pupils peaks in 2007 with 725,800. Then the total number of pupils will decrease steadily. Figure 4.1. Number of pupils per type of school, 2000 and 2006
Figure 4.2. Average number of pupils per school, 2000 and 2006
Figure 4.3. Extrapolation of the total number of pupils in all types of schools
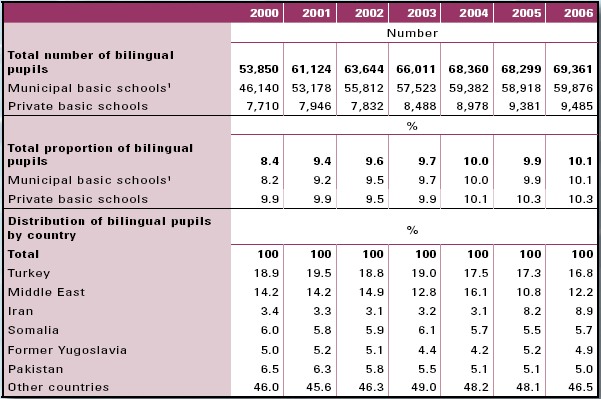
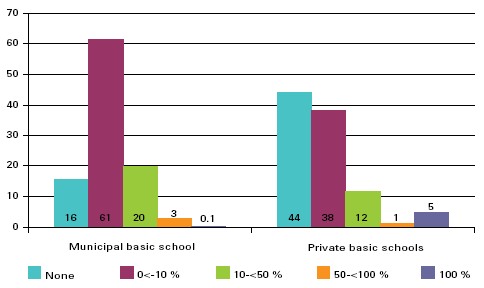
4.2 Bilingual pupilsThe proportion of bilingual pupils in the municipal basic schools and in the private basic schools has increased from 8 % in 2000 to 10 % in 2006. Primarily pupils with a family background from Turkey, the Middle East, and Iran make up the body of bilingual pupils. In 2006, a good 10 % of the pupils in basic school (excluding continuation schools) were bilingual. Bilingual pupils by definition are children who have a maternal language other than Danish, and who do not learn Danish until they come in contact with the surrounding community or through the teaching in school. From 2000 through 2006, the number of bilingual children increased from slightly less than 53,900 to 69,400, equivalent to a 29 % increase. Aside from a small decrease in 2005, the increase has been steady (table 4.3). The proportion of bilingual pupils in the private basic schools has generally been higher than the corresponding proportion in the municipal basic schools. Through the years, however, the two proportions have converged, and in the year 2006, both were a good 10 %. In municipal basic schools, the proportion of bilingual pupils corresponded to 59,900 pupils, while in the private basic schools it corresponded to 9,500 pupils. More than half of the bilingual pupils in basic school have a family background from Turkey, the Middle East, Iran, Somalia, the former Yugoslavia, or Pakistan. With 17 %, the largest group consists of pupils with a Turkish family background; however, this is a smaller proportion than in 2001 when that group made up 20 %. Since 2004, the proportion of bilingual pupils with an Iranian background has more than tripled from 3 % to 9 % in 2006. Regarding the distribution of bilingual pupils in municipal basic schools, the majority by far (77 %) of the schools have less than 10 % bilingual pupils. In comparison, a good 82 % of the private basic schools have less than 10 % bilingual pupils (figure 4.4). In 97 % of the municipal basic schools, less than half of the pupils are bilingual, and the same is the case for 94 % of the private basic schools. In 3 % of the municipal and in 1 % of the private basic schools, between half and 99 % of the pupils are bilingual. In 0.1 % of the municipal and in almost 5 % of the private basic schools, all pupils are bilingual. Table 4.3. Distribution of bilingual pupils in municipal and private basic schools
Figure 4.4. Proportion of bilingual pupils in municipal and private basic schools, 2006
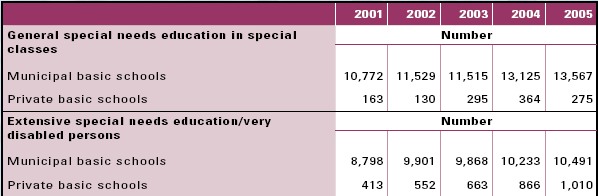
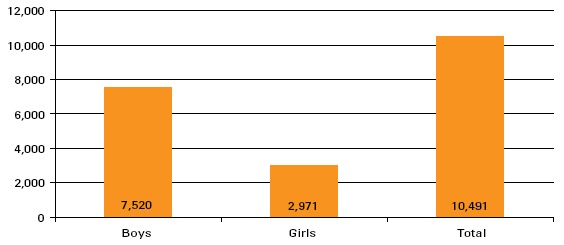
4.3 Pupils receiving special needs educationThe number of pupils receiving general or extensive special needs education has increased markedly from 2001 to 2005. In the municipal basic schools, the number of pupils receiving general special needs education has increased by 26 %, whereas the number receiving extensive special needs education has grown by 19 %. Special needs education is the education given in accordance with the Basic School Act to children and young people whose development poses a requirement for special consideration or support that cannot be given within the framework of the normal education. Before the municipal reforms coming into effect on 1st January 2007, there were two kinds of special needs education: general and extensive. General special needs education under municipal management comprised for example pupils who had difficulties in single subjects or had difficulties reading and writing, and it frequently took place in the pupils regular school, either as special support in the classroom or in special classes. Extensive special needs education under county management comprised specific and expensive measures, and frequently it took place as extra support in the regular classroom, in a special county school, or in a special care institution or in a daytime therapeutic institution. This involved for example pupils with a hearing impairment, autism, or psychical development restraints. Beginning 1st January 2007, there is no longer a distinction between extensive and general special needs education since both kinds of special needs education are now a municipal responsibility, whereas it formerly was divided between counties and municipalities. Special needs education also takes place in the private basic schools; here, the group of pupils requiring additional expenditure is designated severely disabled pupils. In 2005, 13,600 pupils in municipal basic schools received general special needs education in special classes compared to 10,800 in 2001 (table 4.4). This corresponds to an increase of 26 %. In the same period, the number of pupils in municipal basic schools (including pupils in special schools) increased by 4 %. Likewise, the number of municipal basic school pupils in extensive special needs education has increased. In 2005, 10,500 pupils received extensive special needs education compared to 8,800 pupils in 2001. This corresponds to an increase of 19 %. For the severely disabled pupils, the private basic schools may apply to the Board of the State Education Grant and Loan Scheme (the SU Board) for a subsidy for special pedagogical support (SPS). A direct comparison of private basic schools and municipal basic schools in this respect is not possible because the statistical bases differ. For instance, it should be noted that the private basic schools, unlike the municipal basic schools, are not under obligation to admit all the children who apply to the schools. Like in the municipal basic schools, the number of pupils in general special needs education classes in the private basic schools has increased. Thus, from 2001 through 2005, the number increased by 58 %. In absolute numbers, however, the increase is only from 163 to 275 pupils. In comparison, the number of pupils in the private basic schools increased by 13 % from 80,100 to 90,800 in the same period. The number of severely disabled pupils in the private basic schools grew from 413 in 2001 to 1,010 in 2005, an increase of 145 %. This is a consequence, among other things, of the circumstance that there are now more pupils in the private basic schools, and therefore, the variation of the pupil population is assumed to approach that of the municipal basic schools. Figure 4.5 illustrates the number of pupils in extensive special needs education in the municipal basic schools as a proportion of the total number of children between six and sixteen years of age. General learning disability is the most frequent reason of referral of pupils to extensive special needs education and amounted to 43 % of the pupils in 2005. This category covers widely and includes persons who are mentally retarded, late developers, etc. In 2005, 23 % of the pupils were referred because of behavioural and mental difficulties (figure 4.6). In the extensive special needs education in municipal basic schools, the boys are distinctly overrepresented, and in 2005, they made up 72 %, corresponding to 7,500 pupils of a total of 10,500 (figure 4.7). Table 4.4. General and extensive special needs education in municipal and private basic schools
Figure 4.5. Percentage of pupils in extensive special needs education in municipal basic schools in percent of the total number of children in the age group 6-16 years.
Figure 4.6. Reasons for referral to extensive special needs education in municipal basic schools, 2005, percent
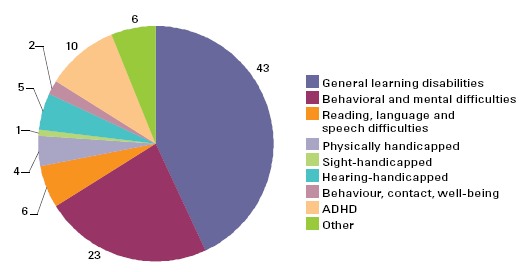
Figure 4.7. Pupils in extensive special needs education in municipal basic schools by gender, 2005
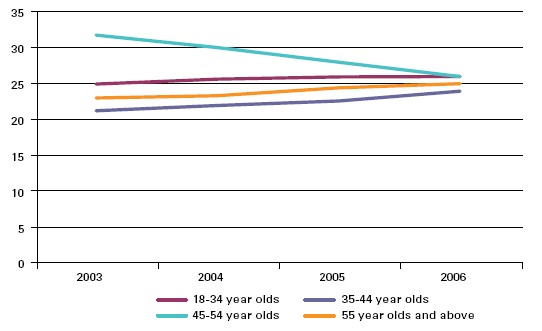
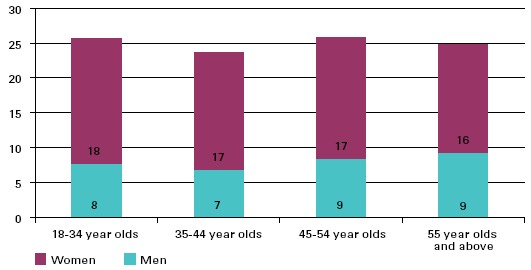
4.4 Number of teachersIn 2006, there were 62,600 teachers in the basic schools. Two thirds of the teachers are women. In the year 2006, there were 62,600 teachers in the basic schools. 51,400 of these were employed by municipal basic schools, 7,500 by a private basic school, and 3,700 were employed by a continuation school (table 4.5). From the year 2003 through 2004, the number of teachers in municipal basic schools decreased by 700. Subsequently, the number of teachers increased by good 600 up to 2006. From 2003 through 2006, there was an increase of good 500 teachers in the private basic schools. In the continuation schools, the number of teachers increased by 200 from 2004 through 2006. When considering the age distribution of the teachers in basic school (excluding continuation schools), it is seen that in particular the group of 45 to 54 year olds has diminished in recent years, although the group is the largest throughout all of the period. Thus, in 2003, the group of 45 to 54 year olds made up 32 % as compared to 26 % in 2006. During the same period, the group of teachers over 55 years old has increased by two percentage points, whereas teachers in the age group 35 to 44 years old has increased by nearly three percentage points. The proportion of teachers 34 years of age or less has increased by a good percentage point (figure 4.8). In general, the teachers in the private basic schools with 42.8 years of age in average are slightly younger that those in the municipal basic schools who are 47.7 years old in average. The gender distribution among teachers and school managers is skewed. Two out of three teachers are women. On the other hand, two out of three school managers are men (does not emerge from the table). The gender skew is strongest among teachers in the youngest age group (figure 4.9). Table 4.5. Number of teachers in basic school
Figure 4.8. Age distribution of teachers, percent
Figure 4.9. Age distribution of teachers by gender, 2006, percent
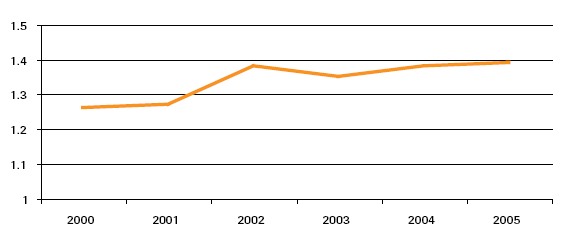
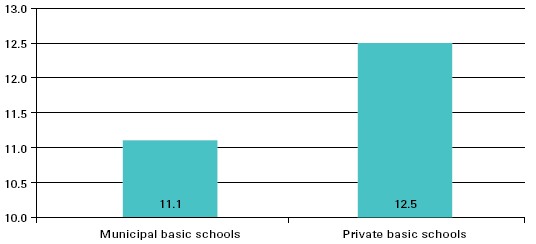
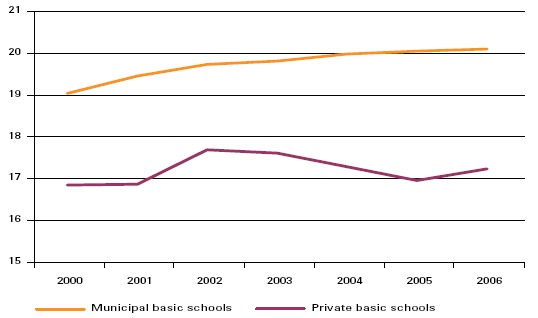
4.5 Pupil/teacher ratio and normal class sizeCompared with the municipal basic schools, there are slightly more pupils per teacher in the private basic schools. The normal class size has been increasing in the municipal as well as in the private basic schools. The pupil/teacher ratio describes the ratio between the number of pupils and the number of teachers, that is to say the average of number of pupils per teacher. In 2006, the pupil/teacher ratio was 11.1 in the municipal basic schools, whereas it was 12.5 in the private basic schools. Thus, there are slightly more pupils per teacher in the private basic schools (figure 4.10). These numbers have not changed notably in recent years. The normal class size expresses the average number of pupils in a class. Dedicated special classes are not counted in the normal class size calculation. In recent years, the normal class size in municipal basic schools has increased. In 2000, the average number of children in a class was 19.0, while in 2006 it was 20.1. During the period, the class-size average has thus increased by one pupil (figure 4.11). The private basic schools have also had a small increase in the normal class size, from 16.8 children in a class in 2000 to 17.2 in 2006. The variation in normal class size is greater in the private basic schools than in the municipal basic schools; here, there has been a slight increase during the entire period. The increase in normal class size is primarily a result of fewer municipal basic schools, while simultaneously, there has been an increase in the number of pupils. Figure 4.10. Pupil/ teacher ratio, 2006
Figure 4.11. Normal class size in municipal and private basic schools 2000-2006
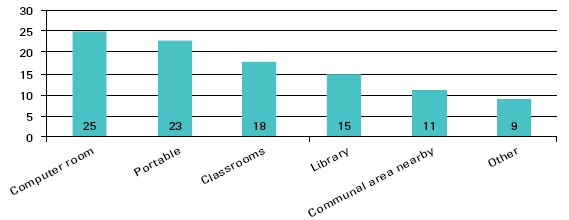
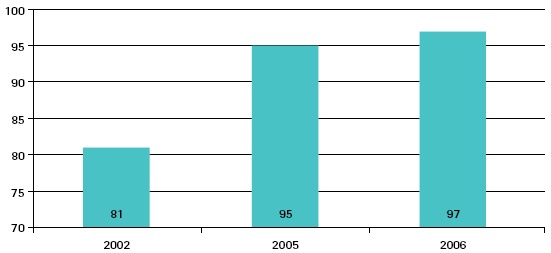
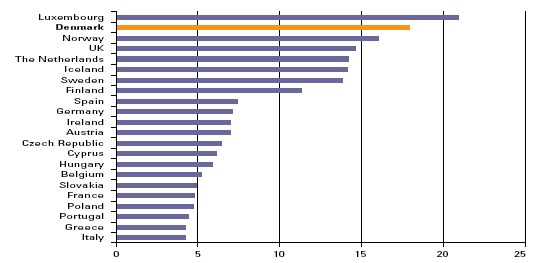
4.6 Key figures for use of computers in Denmark and selected countriesIn 2006, there were nearly five pupils for each newer teaching computer in municipal basic schools. 97 % of the computers were connected to the Internet. Denmark has chosen to concentrate on computers as a means to support and stimulate the pupils in the education. Thus, in 2003, the government adopted a plan of action with the aim to strengthen the computer skills of the basic school pupils. As a result of this plan of action, the number of pupils per newer computer2 dropped markedly, and in 2006, there were less than five pupils per newer teaching computer in municipal basic schools as compared to nearly 10 pupils in 2002. Figure 4.12 shows how the computers were distributed in the municipal basic schools in 2006. 25 % of the computers were placed in a computer room, while 18 % were placed in a classroom and 11 % in a communal area nearby. 23 % of the computers were portable. In 2006, 97 % of the computers in municipal basic schools had Internet access. In 2002, this proportion was 81 % (figure 4.13). A survey of the use of computers in the basic school in the EU countries3, initiated by the European Commission, shows that Denmark had 18 computers with access to the Internet per 100 pupils in 1st through 6th form in 2006. This is the second highest number in EU. The highest number is found in Luxembourg, which had 21 computers with access to the Internet per 100 pupils. Norway and UK follow just after Denmark with 16, respectively 15 computers with access to the Internet per 100 pupils (figure 4.14). There is a relatively clear clustering of EU countries with at least 14 computers with access to the Internet and of those with less than 10. Luxembourg, Denmark, Norway, UK, the Netherlands, Iceland, and Sweden had at least 14 computers with Internet access per 100 pupils in 1st through 6th form. Finland had 11 computers with Internet access per 100 pupils, whereas the rest of the countries had less than 10 computers with access to the Internet per 100 pupils in 1st through 6th form. Figure 4.12. Distribution of teaching computers in municipal basis schools in percent, 2006
Figure 4.13. Proportion of teaching computers with Internet access in municipal basic schools
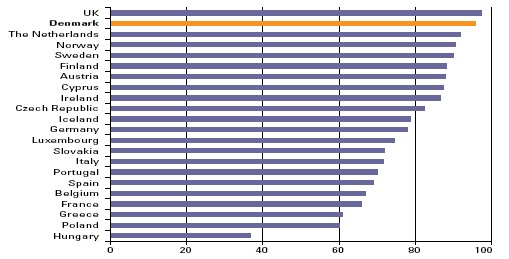
As seen from figure 4.15, 96 % of the teachers in Danish basic schools had used computers in their teaching. Only UK had a higher proportion (97 %). With the exception of Hungary where 37 % of the teachers had used computers in their teaching, at least 60 % of the teachers in 21 of 22 selected EU countries had used computers in their teaching. Figure 4.14. Number of teaching computers with Internet access per 100 pupils in 1st through 6th form of basic school, in Denmark and selected EU countries, 2006
Figure 4.15. Percentage of teachers in 1st through 6th form who have used computers in teaching in the last 12 months in Denmark and selected EU countries, 2006
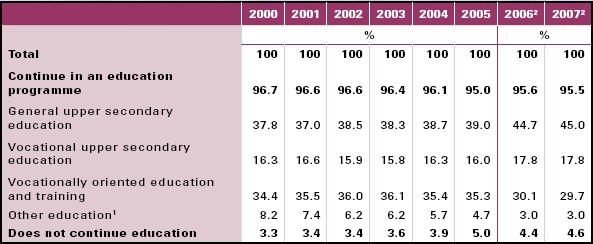
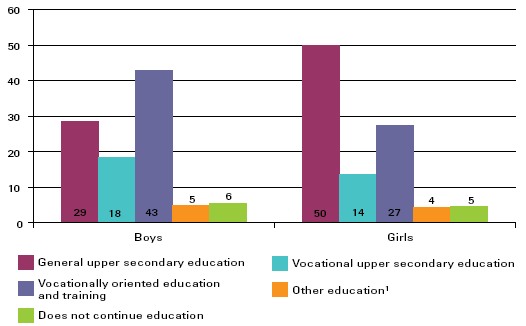
4.7 What do pupils do after basic school95 % continue in an education after having completed basic school. The girls primarily choose the general upper secondary education, whereas the boys prefer a vocationally oriented education and training programme. Nearly all pupils continue in a youth education after basic school. In the spring 2007, almost 96 % of the pupils in 9th and 10th form had enrolled to start an education directly after the summer holidays (table 4.6). At the youth education enrolment of the 9th and 10th form pupils in 2007, 45 % enrolled in a general upper secondary education programme, while nearly 18 % enrolled in a vocational upper secondary education programme. Almost 30 % of the graduating pupils enrolled in a vocationally oriented education and training programme. It is, however, questionable which education the young people will choose in reality. In recent years, a steadily increasing proportion of the pupils, who continue in an education, start in an upper secondary education programme. In 2005, 39 % started a general upper secondary education, whereas 16 % enrolled in a vocational upper secondary education programme. In the same year, 35 % started a vocationally oriented education and training programme. There is a distinct difference in boys and girls choice of education. While half of the girls chose a general upper secondary education programme, this was the case for only 29 % of the boys. On the other hand, a larger proportion of the boys (18 %) than of the girls (14 %) chose a vocational upper secondary education. A vocationally oriented education and training was also chosen primarily by the boys. Thus, 43 % of the boys but only 27 % of the girls chose a vocationally oriented education and training (figure 4.16). Table 4.6. Behaviour after basic school
Figure 4.16. Behaviour after basic school by gender, 2005, percent
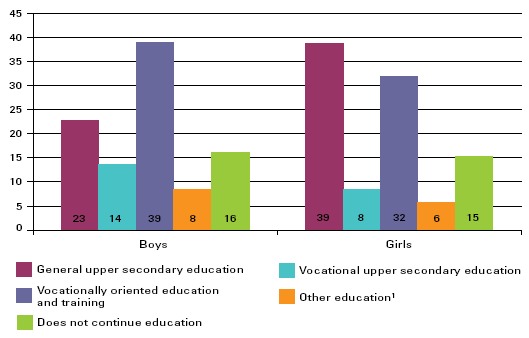
Figure 4.17 shows the distribution of immigrants and descendants by gender who continue in education after the 9th and 10th form. The trend is the same for this group: the girls chose primarily a general upper secondary education, whereas the boys chose a vocational upper secondary education, in particular the higher technical examination (htx), and vocationally oriented education and training programmes. However, a far greater percentage of immigrants and descendants do not continue in an education programme. Whereas 6 % of the boys in total do not continue in an education programme, this is the case for a good 16 % of the boys among immigrants and descendants. As for the girls, a little less than 5 % of the total group do not continue in an education programme, whereas it is the case for a good 15 % of the girls in the group of immigrants and descendants. Figure 4.17. Behaviour of immigrants and descendants after basic school by gender, 2005, percent
Footnotes
2) Newer computers are defined as computers less
than five years old or used as terminals of a centralized
server.
|
||
|
To the top of the page |