|

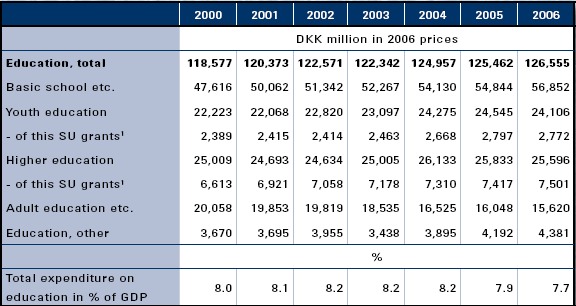
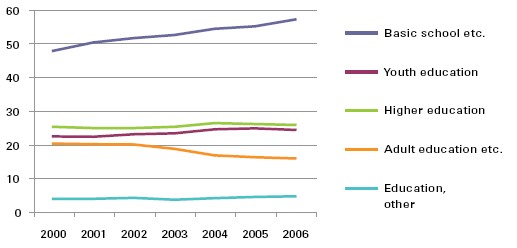
3 FinancesThe 2006 total public expenditure on education amounted to DKK 126.6 billion, corresponding to 7.7 % of the gross domestic product. From 2000 to 2004, the expenditure increased in real terms as well as in proportion of the gross domestic product. 3.1 Total public expenditure on educationThe 2006, total public expenditure on education amounted to DKK 126.6 billion, corresponding to 7.7 % of the gross domestic product (GDP). From 2000 to 2006, the expenditure on education increased by a good 6 % in real terms. Since the increase in GDP has been greater than the increase in total public expenditure on education, the total expenditure on education as a percentage of the GDP decreased from 2004 to 2006. The biggest share of the expenditure on education goes to the basic school where at the same time the biggest increase in expenditure was seen well over 16 % from 2000 to 2006. In 2006, the basic school expenditure amounted to a total of DKK 56.9 billion. This includes municipal and private basic schools, continuation schools, and youth schools, etc. The expenditure on youth education grew from DKK 22.2 billion in 2000 to DKK 24.1 billion in 2006 corresponding to an increase of nearly 8 %. This includes an increase of 14 % of the expenditure on student grants. The expenditure on higher education increased by 2.3 % from 2000 to 2006. In the year 2006, a total of DKK 25.6 billion was spent on higher education. The category Adult education etc. comprises expenditure on adult education, Danish lessons for immigrants, production schools, popular enlightenment, folk high schools together with state expenditure on adult and continuing education. In 2006, these expenses amounted to a total of DKK 15.6 billion. Figure 3.1 is a graphic representation of the development in public expenditure at various levels of education. Table 3.1. Public expenditure on education distributed by level of education
Figure 3.1. Development in public expenditure distributed by level of education, DKK billion in 2006 prices
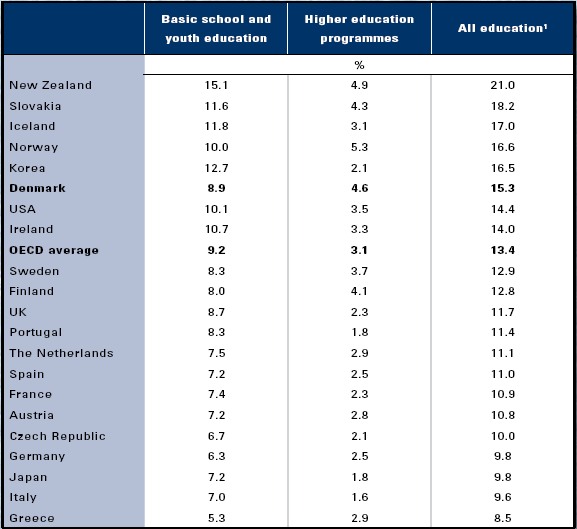
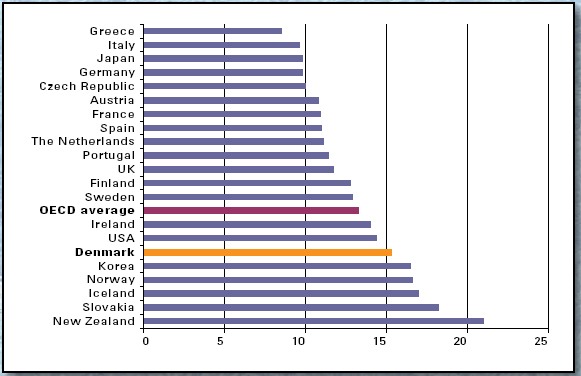
3.2 Public expenditure on education as a percentage of total public expenditure in Denmark and selected countriesThe 2004 public expenditure on education was 15.3 % of the total public spending. This is slightly over the OECD average. The expenditures in these statistics comprise all public expenditure on education including student grants etc. In 2004, Denmark used 15.3 % of the total public expenditure on education (table 3.2). This puts Denmark slightly over the OECD average of 13.4 %; countries such as New Zealand, Norway, and Korea used a larger share of the total public expenditure on education (17-21%). In 2004, the public expenditure on basic school and youth education amounted to 8.9 % of the total public expenditure in Denmark. This is a little less than the corresponding OECD average of 9.2 %. In some countries, the expenditure on the basic school and youth education is somewhat higher than in Denmark. For example, this is the case for New Zealand (15.1 %), Korea (12.7 %) and Iceland (11.8 %). In 2004, public expenditure on higher education amounted to 4.6 % of the total public expenditure in Denmark. This places Denmark over the corresponding OECD average of 3.1 %. Only New Zealand (4.9 %) and Norway (5.3 %) spend larger shares on higher education than Denmark. The large expenditure on higher education in Denmark may partly be ascribed to the relatively large spending on financial support. To some extent, the distribution of the expenditure reflects the composition of the population. Figure 3.2 shows the total public expenditure on education in proportion to the total public expenditure. Table 3.2. Public expenditure on education as a percentage of total public expenditure in Denmark and selected OECD countries, 2004
Figure 3.2. Total public
expenditure on education
(all programmes)
compared to total public
expenditure, in Denmark
and selected OECD
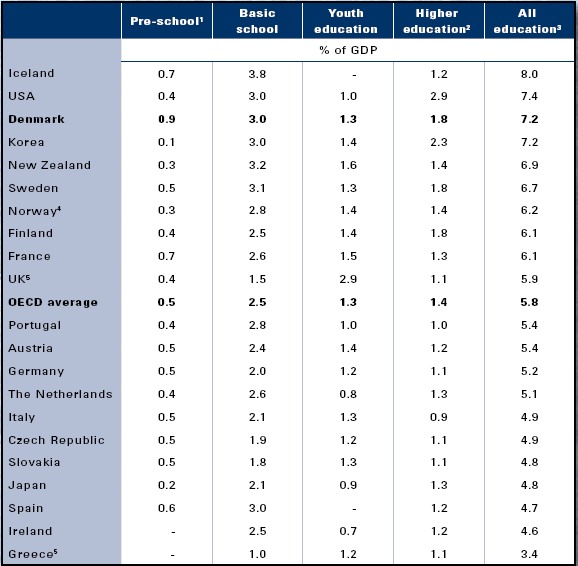
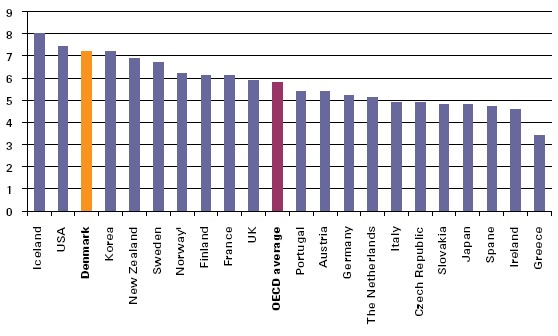
countries, 2004, percent 3.3 Total public and private expenditures on educational institutions in Denmark and selected countriesCompared to other countries, Denmark uses many resources on educational institutions at all levels. In the year 2004, the total expenditure (public and private) on educational institutions in Denmark amounted to 7.2 % of the gross domestic product. In 2004, the total public and private expenditure on educational institutions in Denmark amounted to 7.2 % of the gross domestic product. The corresponding OECD average was 5.8 % (table 3.3). Thus, the total Danish expenditure was only surpassed by Iceland (8.0 %) and USA (7.4 %). The statistic only covers expenditure on educational institutions, so disbursements for public transfer income such as state education grants are not included. The majority of the countries spend the most money on basic school. However, the distribution of expenditure between the various education levels depends on the demography of each country. In particular, when compared to other countries, the expenditure on pre-school (kindergarten and preschool class) and basic school is high in Denmark. In 2004, expenditure on pre-school amounted to 0.9 % of GDP compared to an OECD average of 0.5 %. In Denmark, the expenditure on basic school amounted to 3.0 % of the GDP, while the OECD average was 2.5 %. In 2004, the Danish expenditure on youth education amounted to 1.3 % of the GDP, which was the same as the OECD average. In 2004, the expenditure in Denmark on higher education was 1.8 % of the GDP, whereas the OECD average was 1.4 %. In Korea and USA, the expenditure on higher education was high making up 2.3 % and 2.9 % respectively of the GDP. The total private and public expenditure on educational institutions at all levels show a wide variation among the OECD countries. Denmark is among the countries spending the most resources in relation to the GDP (figure 3.3). Table 3.3. Total public and private expenditure on educational institutions as a percentage of GDP in Denmark and selected OECD countries, 2004
Figure 3.3. Total public and private expenditure on educational institutions, all programmes, as a percentage of GDP in Denmark and selected OECD countries, 2004
3.4 Total public and private expenditures per pupil/ student in Denmark and selected countriesCompared to other OECD countries, Denmark spends many resources per pupil in basic school and youth education. Denmark also uses more than the OECD average per student in higher education. This statistic only covers expenditure on educational institutions; thus, disbursements for public transfer income such as state education grants are not included. In 2004, the expenditure per pupil in the 7th through 10th form of basic school was the equivalent of USD 8,224 per year. Thus, Denmarks expenditure per pupil was considerably above the OECD average (USD 6,909) For the 1st through 6th form, the expenditure was USD 8,081 per year, only surpassed by Norway and USA (table 3.4). In Denmark in 2004, the expenditure per pupil on youth education was USD 9,466, whereas the OECD average was USD 7,884. In Norway, France, Germany, Austria, and USA, however, the expenditure per pupil was higher with Norway spending most (USD 12,498 per pupil). In Denmark in 2004, the average cost per student in higher education was USD 15,225 per year. The OECD average was USD 11,100. The cost in USA was more than twice the OECD average, that is USD 22,476 per student. The rightmost column of the table shows the total expenditure on basic school as well as youth education per pupil calculated based on the theoretical duration of the education programmes. The theoretical duration of the education programmes is 12-13 years in 29 of 34 OECD and partner countries1 (does not emerge from the table). The education programmes are therefore relatively of the same duration. In spite of this, there is a big variation in the total expenditures. In 2004, the expenditure per student varied from less than USD 60,000 in Greece, the Czech Republic, and Slovakia to more than USD 100,000 in Norway, USA, Denmark, and Austria There is a certain uncertainty to this kind of statistic; however, the numbers reflect factual differences in the way in which the countries prioritize resources for the various education levels. Table 3.4. Total public and private expenditure per pupil/student per year in Denmark and selected OECD countries converted using PPP1 in USD, 2004
There is a relatively wide variation in the expenditure per pupil/student at all educational levels in the OECD countries. For example, the expenditure varies from approximately USD 2,000 to just under USD 9,000 per student in 1st through 6th form (figure 3.4). Figure 3.4. Total public and private expenditure in USD per pupil in 1st through 6th form, in Denmark and selected OECD countries, 2004
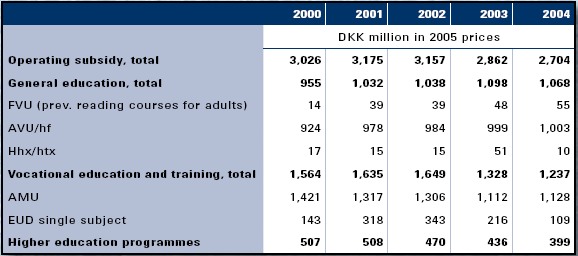
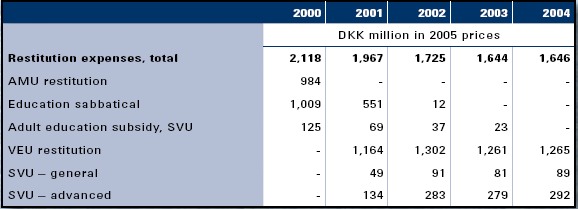
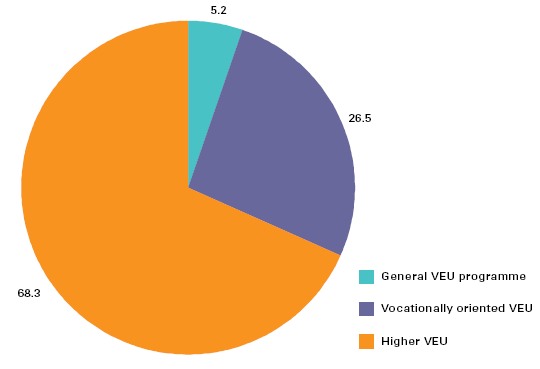
3.5 Public expenditure on adult and continuing educationThere are adult and continuing education offers within general, vocational, and higher education that receive public operating subsidy. The public operating subsidy for adult and continuing education amounted to DKK 2.7 billion in 2004. In 2004, the public operating subsidy for adult and continuing education (VEU) amounted to a total of DKK 2.7 billion in 2004. The operating subsidy to the general education programmes was DKK 1.1 billion in 2004 (table 3.5). The general education programmes comprise the preparatory adult education (FVU), general adult education (AVU) and upper secondary education (single subjects within the higher preparatory courses (single subject hf ), the higher commercial examination (hhx), the higher technical examination (htx), and upper secondary school leaving examination (stx).Vocational-oriented VEU only includes the adult vocational training programmes (AMU) and single subject EUD etc. In 2004, the operating subsidies to these amounted to DKK 1.2 billion with just over 91 % going to AMU. The higher education programmes include single subjects in short-, intermediate-, and long-cycle higher education programmes. Additionally, there are short-cycle and intermediate-cycle higher education programmes directly under open education programmes such as the market economist education and the datamatician education as well as the merit teacher and merit pedagogue education or diploma and masters programmes (part-time). In 2004, the operating subsidies to higher education amounted to DKK 0.4 billion. From 2000 through 2004, the public operating subsidies decreased by 11 %, which should be viewed in the light of rationalizations following institution mergers, transition to increased demand control via user payment, introduction of subsidy ceilings, harmonization of fees, and a change in the composition of the education activity. There are various possibilities for compensation of loss of income during the education. In addition to operating subsidies to the amount of DKK 2.7 billion in 2004 in connection with carrying out the VEU activities, the participants were paid compensation in the amount of DKK 1.6 billion. From table 3.6, it emerges how the reforms in the area have changed the possibilities for compensation. Education leave and the so-called AMU compensation have been phased out, and a VEU compensation was introduced starting from the year 2001. The disbursement of DKK 1.3 billion for VEU compensation in 2004 concerns persons who participate in a vocationally oriented VEU up to and including the vocational education and training level. This includes AMU. The disbursement for VEU compensation amounts to 77 % of the total cost of compensation for loss of income. The state adult education grants (SVU) are apportioned with DKK 0.1 billion to the general SVU, which concerns the general education programmes, and DKK 0.3 billion to the higher SVU, which is allotted to persons seeking adult and continuing education within higher education programmes. Figure 3.5 shows the distribution of tuition paid by students in each type of VEU. Of the total student paid tuition of DKK 676 million in 2004 (not shown in the diagram), the students in higher VEU paid DKK 462 million corresponding to 68 % of the total student paid tuition, while the students in vocational-oriented VEU paid DKK 179 million, and the students in the general VEU programme paid DKK 35 million corresponding to 5 %. Table 3.5. Public operating subsidy per type of VEU
Table 3.6. Restitution expenses
Remark: The table does not include
expenditure on popular enlightenment
(folk high schools, evening courses and
day folk high schools), special needs
education for adults or expenditure on Danish courses for foreigners.
Figure 3.5. Distribution as a percentage of student paid tuition in VEU education, 2004, in 2005 prices DKK
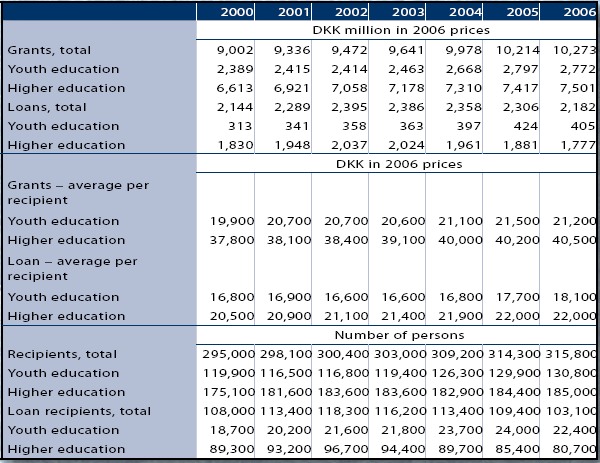
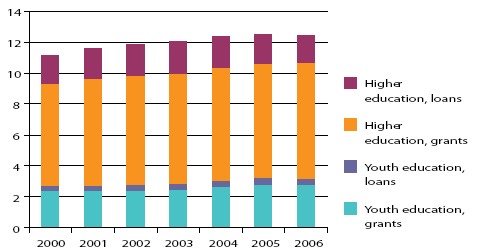
Source: Livslang opkvalificering og uddannelse for alle på arbejdsmarkedet, 2006 [Lifelong upgrading of qualifications and education for everyone in the labour market, 2006]. 3.6 Expenditure on the State Education Grant and Loan SchemeIn 2006, the State Education Grant and Loan Scheme disbursed DKK 12.5 billion in grants and loans to pupils and students. 75 % of the expenditure on education grants went to higher education students. The state education grants and loans are administered on a monthly basis. There are di erent rates of grants for students living at home and students living away from home, whereas the loan rate is the same. Loans are only allotted in connection with a grant. The students are allowed to have a monthly income in the form of salary in addition to the grant. In 2006, the total allocation of grants and loans from the State Education Grant and Loan Scheme amounted to DKK 12.5 billion. Of these, DKK 10.3 billion were allotted as monthly grants to 315,800 persons, while the rest was allotted as loans (table 3.7). From year 2000 through 2006, the expenditure on grants from the State Education Grant and Loan Scheme rose by 14 % from DKK 9.0 billion to DKK 10.3 billion. During the same period, the number of grant recipients grew from 295,000 to 315.800 corresponding to a 7 % increase, whereas the number of loan recipients fell from 108,000 to 103,100 corresponding to a decrease of nearly 5 %. In 2006, the average grant recipient in youth education received grants in the amount of DKK 21,200, whereas a grant recipient in a higher education programme received an average of DKK 40,500 per year. In 2006, loan recipients in a higher education programme borrowed an average of DKK 22,000, while loan recipients in youth education borrowed an average of DKK 18,100. The number of loan recipients in higher education is approximately four times the number of loan recipients in youth education. As seen from figure 3.6, there has been an increase over the recent six years in the total expenditure on the State Education Grant and Loan Scheme. However, the growth seems to have stopped at a level where the total expenditure corresponds to just short of DKK 13 billion. Furthermore, it is noted that most is spent on higher education both for loans and grants. The proportion spent on loans to students in youth education is relatively modest. Table 3.7. Expenditure on the State Education Grant and Loan Scheme
Figure 3.6. Expenditure on grants and loans for youth education and higher education, DKK billion in 2006 prices
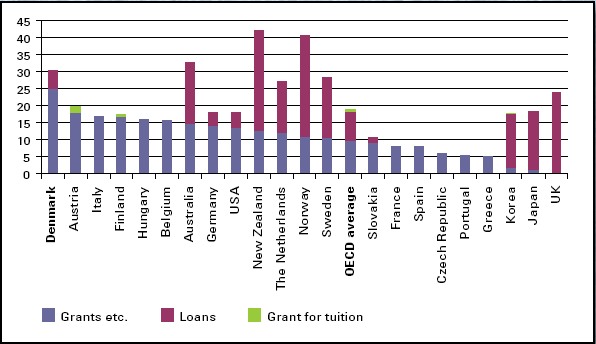
3.7 Expenditure on financial support of students in higher education in Denmark and selected countriesIn 2004, the OECD countries spent an average of 18 % of the total public expenditure on higher education on financial support to the students. Denmark spent 30 %. While expenditure on grants and other transfer income is sizeable in Denmark, relatively little is spent when comparing internationally on loans to students. In 2004 in Denmark, 5 % of the total public expenditure on higher education went to loans. The OECD average was just short of 9 %. There is a large variation in the amounts each country uses on grants and other transfer income and on loans. Denmark is the country that uses the most on grants and other transfer income. In 2004 in Denmark, 25 % of the total expenditure on higher education was spent on grants and other transfer income; this places Denmark in the very top. In average, the OECD countries spend approximately 10 % of the total expenditure on higher education on grants and other transfer income. Among the Nordic countries, Finland spends 17 % on grants and other transfer income, while Norway and Sweden are very close to the OECD average. Korea, Japan, and UK spend a very small share on grants and other transfer income, but a high proportion on loans. Note that this statistic on financial support includes not only the State Education Grant and Loan Scheme, but all forms of transfer income that is paid in connection with higher education, for example the State adult education support scheme (SVU), Adult and continuing education compensation (VEU), social security cash benefit, and rehabilitation. As seen from figure 3.7, there is a wide variation in the countries expenditure on loans. In Sweden and Norway, the students borrow approximately 18 % and 30 % respectively of their total expenditure on higher education. Overall, the students in over one third of the countries borrow considerably more than Danish students who, on the other hand, receive high grants and other transfer income. Note, however, that in some countries it is not possible to account for the loans. A few countries give grants to pay for tuition. For example, this is the case in Austria and Finland; however, this is not relevant for Danish students. Figure 3.7. Percentage of total public expenditure on higher education used for grants and other transfer income, loans, and grants for tuition in Denmark and selected OECD countries, by type of expenditure 2004
Footnotes1) Partner countries are primarily African, Asian, and South American countries that participate in the OECD/UNESCO cooperation but have not achieved full membership.
|
||
|
To the top of the page |