|

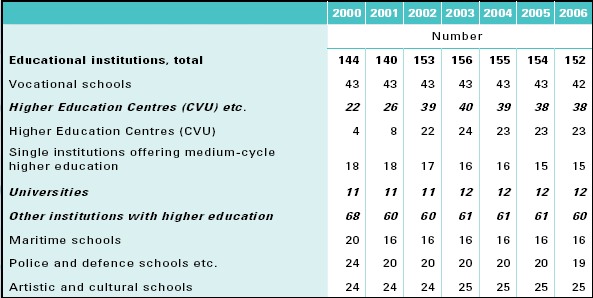
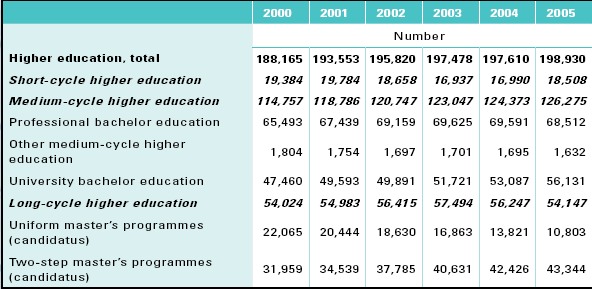
6 Higher education6.1 Number of institutions and studentsIt is the governments goal that 50 % of a year group receive a higher education in 2015. Today, almost 44 % of a youth cohort is expected to receive a higher education. In 2006, there were 152 institutions offering higher education. They vary greatly in size from big universities with thousands of students to small institutions with but a few (table 6.1). Today, there are many ongoing changes and reorganizations of the structure of institutions. In 2007 several universities have been merged and amalgamated with sector research institutions, so from 2007 there are eight universities in Denmark. Furthermore, the major part of medium-cycle higher education is consolidated in seven professional higher schools, while the short-cycle higher education programmes are combined in ten vocational academies. In 2005, 198,900 students studied in a higher education programme. Of these, more than 55 % (that corresponds to 110,300) studied in a university programme, 34 % (that corresponds to 68,500) in a professional bachelor programme and 9 % (that corresponds to 18,500) in a short-cycle programme (table 6.2). During the period 2000-2005, there has been a population increase of 9 % in the university education programmes. The professional bachelor education programmes have experienced an increase of 5 %, whereas short-cycle education got almost 5 % fewer students in that period. The increase in medium-cycle higher education, in particular, is owed to the number of students in university bachelor programmes having gone up by 18 %. That corresponds to 8,700 students. The increase in number of students in university bachelor programmes is especially due to the structural change that has taken place in the university field since 1993, and that has lead to long-cycle higher education being separated into a bachelor programme and a masters programme (candidatus). This means that the former unity masters programmes (candidatus) have been replaced with a university education programme divided in two parts where the students first must complete a university bachelor education before being admitted to a masters programme (candidatus). An increase is noted in medium-cycle higher education because the university bachelor programmes are placed in that group. To some extent, the increase in the bachelor programmes corresponds to the decrease in the masters programmes (candidatus). Table 6.1. Number of institutions offering higher education
Table 6.2. Number of students per higher education programme
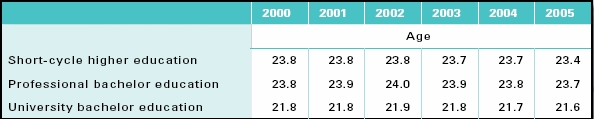
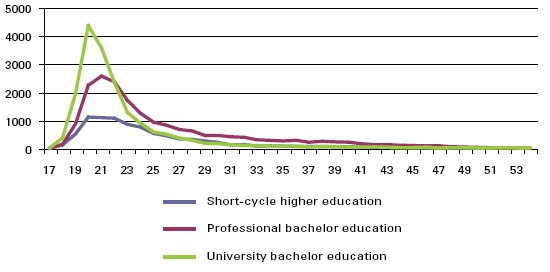
6.2 Age at startIn 2005, the young people are a little quicker at getting started on an education than they were in 2000. Furthermore, young people in vocational upper secondary schools are quicker at getting started than young people in general upper secondary schools. The time passing until the young people start a higher education after upper secondary school varies depending on whether they come from a general upper secondary or a vocational upper secondary school and depending on which education they start. In general, the young people who have attended a vocational upper secondary school are a little quicker in starting a higher education than those who have attended a general upper secondary school. In consequence, the students are now younger when they start their studies. Since 2002, the median age at the start of a higher education has been decreasing. Table 6.3 illustrates the median age at the start of study. The median age is the middle value in the age distribution. It means that the number of students that are younger than the stated age is equal to the number of students that are older. The median age for students starting a short-cycle higher education in 2005 was 23.4 years. Thus, there is a slight decrease in the age of the students since 2002 where the median age of the students was 23.8 years. In 2005, for the students in the professional bachelor education programmes, the median age was 23.7 years at the start of study; this is a decrease compared to 2002 when the median age was 24 years. In university bachelor education, the students had a median age of 21.6 years at the start of study compared to 21.9 years in 2002. Although the greater part of the students in short- and medium-cycle higher education is in the beginning of the twenties at the start of study, a relatively large part of the students have a very high age when they start their study (figure 6.1) The high age at the start of study is partly owed to the fact that only 38 % in short-cycle higher education and 49 % in medium-cycle higher education come directly from a higher study preparatory school. The balance has another discontinued or completed education behind them. Thus, many of the fresh students have started before and subsequently changed their study. Table 6.3. Median age of students when starting their studies
Figure 6.1. Number of students by age at the start of study, 2005
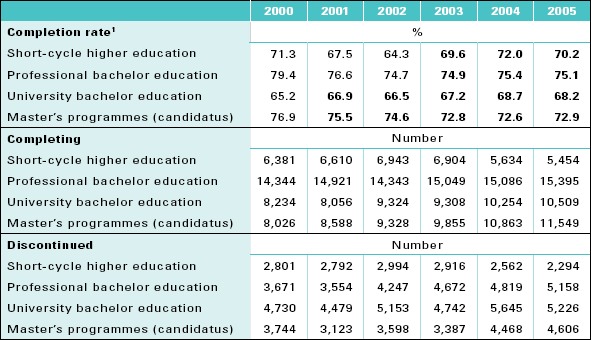
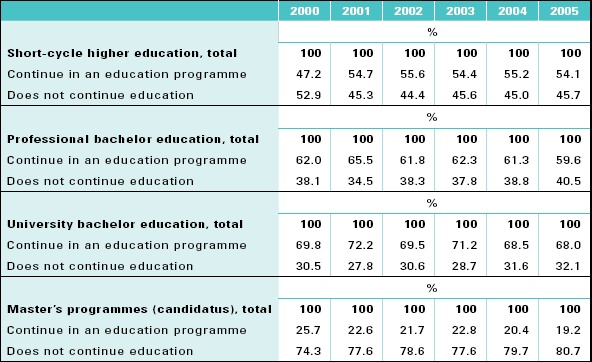
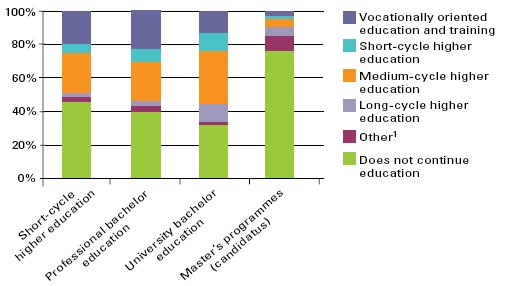
6.3 Completion, dropout, and behaviour after dropoutApproximately 70 % complete a higher education. The majority of those who do not complete start a new education. The completion rate is a measure of the proportion of students who have started an education programme the year in question, and who finish that programme. In the short-cycle higher education programmes, the completion rate is 70 %. In the professional bachelor programmes, the rate is slightly higher, namely 75 %. In the university bachelor education, the completion rate is 68 %. In the masters programmes (candidatus), the completion rate is 73 % (table 6.4). In 2005, 5,400 completed a short-cycle higher education, 15,300 completed a professional bachelor education, and 10,500 completed a university bachelor education programme. Practically all who complete a university bachelor education continue directly in a masters programme (candidatus). In 2005, 11,500 students earned a masters degree (candidatus). Slightly more than half (54 %) of the students who discontinue a shortcycle higher education are expected to start another education. This is seven percentage points more than in 2002. Especially, they change to the vocationally oriented educational training programmes and medium-cycle higher education programmes (table 6.5). Almost six in ten students who discontinue their professional bachelor education start another education. In this group, especially the vocationally oriented educational training programmes and medium-cycle higher education are preferred. 68 % of the students who discontinue a university bachelor education programme are expected to start another education. Nearly half of this group is expected to start in a mediumcycle higher education programme. Only 19 % of those who have discontinued a masters programme (candidatus) are expected to start another education. The greater part of those who do will start in a mediumcycle higher education programme. Generally, this group has already completed a bachelor education, however. Figure 6.2 shows which education the students start after having discontinued a higher education. Table 6.4. Completion rates. Number of students who complete the education, and number of students who drop out on the way
Table 6.5. Behaviour after discontinued education proportion expected to start another education within ten years
Figure 6.2. Behaviour after discontinued education proportion expected to start another education within ten years, 2005
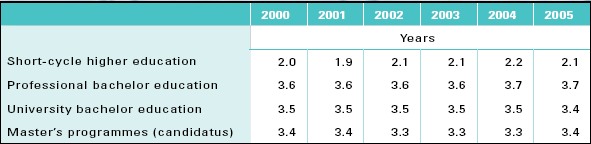
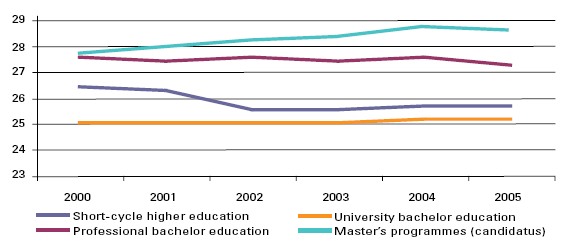
6.4 Length of study and age at graduationStudents in short-cycle higher education and professional bachelor students are better at completing their study in the designated time when compared with university bachelor students. In the short-cycle higher education programmes, the average length of study has been practically constant at two years during the period from 2000 to 2005. In 2005, it was 2.1 years (table 6.6). The quickest 25 % completed the education in a little less than two years, whereas the slowest 10 % take three years to complete. Practically everybody complete in the designated time, and the spread shows the variation in the designated times to complete a programme. Some programmes take almost two years, whereas the longest take four years (for example the police education). Likewise for the professional bachelors, the length of study has been relatively stable in the period shown. In 2005, the students took an average of 3.7 years to complete their study. In this group, the 25 % quickest students took 3.3 years, whereas the 10 % slowest took 4.8 years to complete their study. Likewise in this case, the length of study varies from 3.5 to 4.5 years. Thus, a small group of students take a longer time to complete their studies. The university bachelors took 3.4 years to complete in 2005. From 2000 through 2004, the average time of study was 3.5 years. The 25 % quickest graduated in 2.8 years5, whereas the 10 % slowest students took almost five years to complete. In average, the students thus have a delay in their education of nearly half a year. In the masters programmes (candidatus), the students took an average of 3.4 years to graduate, which corresponds to the level in the years 2000-2004. The 25 % quickest masters students (candidatus) took 2.3 years, whereas the 10 % slowest took 5.6 years to graduate. As the masters programmes (candidatus) have a designated duration of two years, this is where the longest delay is found. Traditionally, students in Denmark have been older of age when graduating, and their age has been increasing. However, it seems that this trend is turning except for the university bachelors where the age has been constant. In 2005, the age of the students who completed a short-cycle higher education was 25.8 years. As such, they were slightly younger than in 2000-2001 when the age was a little over 26 years (figure 6.3). After a slight decrease in 2005, the students who completed a professional bachelor programme were 27.3 years old, whereas the students in the university bachelor programmes with 25.2 years of age were a little more than two years younger. From 2000 through 2005, the students in the masters programmes (candidatus) have generally become slightly older at graduation. From a graduation age of 27.8 years in 2000, the age rose to 28.6 years in 2004. In 2005, the graduation age had fallen slightly to 28.5 years. Table 6.6. Average time to graduate in number of years
Figure 6.3. Median age at graduation
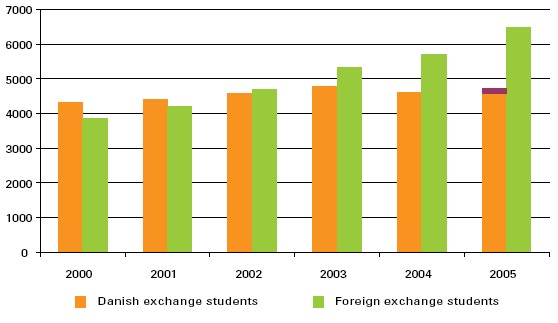
6.5 International mobilityIn higher education, there are more students coming to Denmark than there are Danish students going abroad. This is the case for students in exchange programmes as well as for students taking a full education abroad. The Danish students have the opportunity to complete an education abroad. This may take place through a study visit or a practice placement abroad as a part of a Danish education programme (exchange students) or through students taking a full education abroad. Likewise, foreign students have the option to come to Denmark for a study visit or a practice placement, or they may take a full Danish education. Normally, the exchange visits for students in higher education programmes last three to twelve months, and they give credits. That is to say, the subjects that are completed abroad give credits in the Danish education so that the stay abroad does not prolong the study. Several students in higher education go on an exchange programme supported by an international education programme such as Erasmus or Nordplus. In 2005, this was the case for approximately 45 % of all Danish exchange students. Others went with support from their own educational institution, from private foundations, or financed by themselves. More than 75 % of the foreign exchange students came to Denmark on an international exchange programme. In 2005, 4,744 Danish students completed a study visit or practice placement abroad as a part of a Danish higher education. During the same year, 6,479 foreign students completed an exchange programme in Denmark. The greater part of the exchange students studied in a long-cycle higher education programme (table 6.7). As shown in figure 6.4, the number of Danish exchange students increased from 4,326 in 2000 to 4,785 in 2003. Then the number dropped to 4,606 in 2004 and rose again to 4,744 in 2005. However, the increase seen from 2004 to 2005 is due to the short-cycle higher education programmes being counted from 2005 on. If the short-cycle higher education programmes were not counted, there would have been a status quo. Table 6.7. Number of students in an exchange programme, 2005
Figure 6.4. Number of Danish students in an exchange programme abroad and number of foreign students in an exchange programme in Denmark
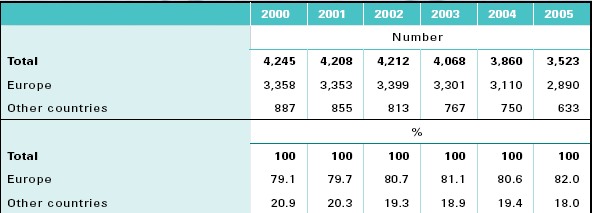
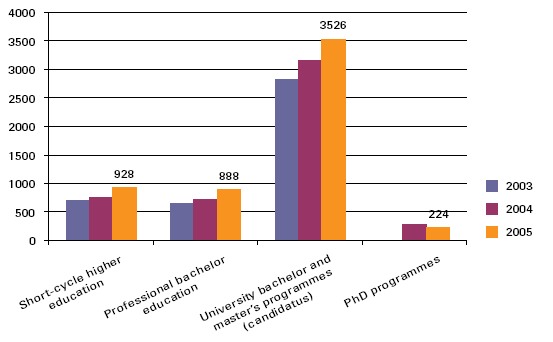
The universities send out the most students. The five countries who received the most Danish exchange students were USA receiving 15 % of the total students abroad, Great Britain (10 %), Germany (9 %), Spain (8 %), and France (7 %). During the same period, the number of foreign exchange students in Denmark has shown an increasing trend. From 2000 to 2005, the number of foreign exchange students increased steadily from 3,849 to 6,479. The universities received nearly three fourth of all foreign exchange students. The most foreign exchange students came from Germany (12 %), France (11 %), Spain (11 %), Italy (8 %), and USA (15 %). Since 2002, more foreign exchange students came to Denmark than Danish exchange students went abroad. While some students choose to take a part of their education abroad, others choose to take the entire education abroad. In 2005, 3,523 Danish students were pursuing a full higher education abroad supported by the State Education Grant and Loan Scheme (SU). Since 2000, this number has dropped 17 %. The majority of the Danish students go to another European country, while 18 % go to countries outside of Europe (table 6.8). England was the preferred country for foreign studies, and 43 % of the Danish students chose to go here. 10 % went to Sweden, 9 % to Norway and USA, and 5 % to Germany. At the same time as the number of Danish students taking a full education abroad has fallen, there has been an increase in the number of foreign students taking a complete education in Denmark. In 2005, there were 5,342 foreign students taking an complete Danish higher education. Add to these 224 foreign PhD students. Except for students from the Nordic countries, the majority of the foreign students take study courses that are offered in English (figure 6.5). In 2005, approximately one third more foreign students came to Denmark than there were Danish students abroad to pursue a full education. The greater part of the foreign students came from China (20 %), Norway (17 %), Iceland (11 %), Sweden (10 %), and Germany (5 %). Table 6.8. Danish students taking a complete course of study abroad
Figure 6.5 Foreign students taking a complete course of study in Denmark
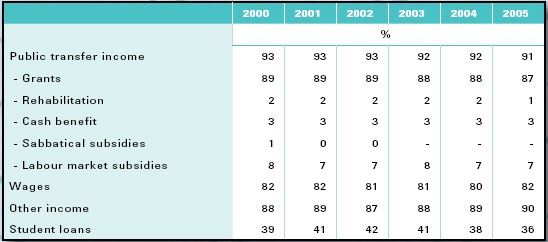
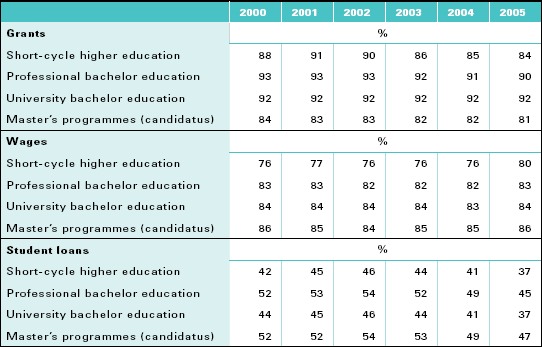
6.6 The students incomeIn 2005, 87 % of the 18-29 year olds in nonpaid education received grants from the State Education Grant and Loan Scheme. In addition, 82 % had paid work, while 36 % complemented their income with student loans. 90 % had other income such as interest, child support, and housing benefits. The students may be either paid, partially paid, or non-paid. The paid education programmes include the vocational education and training main courses of study and the social and health care helper education, while the partially paid programmes comprise the social educator and nursing professional bachelor education. The greater part by far of the students are in a non-paid education programme including the upper secondary schools, the vocational trade basic course of study, and most higher education programmes. In this section, only the 18-29 year old students in non-paid education programmes are considered. Table 6.9 shows the proportion of the 18-29 year old students in nonpaid programmes that received the various types of income in the period 2000-2005. In 2005, 91 % of the students received public transfer income. The greater part of these by far (87 %) received grants from the State Education Grant and Loan Scheme, while 7 % received labour market subsidies, 3 % received cash benefits, and 1 % received rehabilitation support. 82 % had work besides studying, while 90 % had other income such as interest, child support, and housing benefits. The number of students with student loans has dropped from 42 % in 2002 to 36 % in 2005. Table 6.10 shows the proportion of the students in higher education that receive grants, earn wages, and take up student loans. Table 6.10 shows the proportion of the students in higher education that receive grants, earn wages, and take up student loans. The proportion receiving grants has been stable since 2000 in the university bachelor education programmes, while the proportion in the rest of the higher education programmes has decreased by three to four percentage points since 2002. Table 6.9. Proportion of 18-29 year old students in a non-paid education who receive the respective income
Table 6.10. Proportion of 18-29 year old students in a non-paid education who receive the respective income
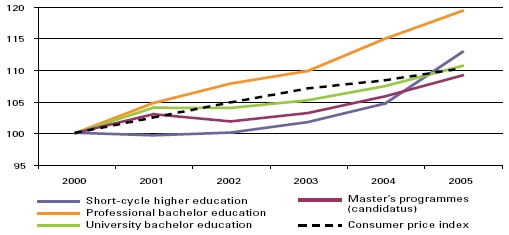
In general, the proportion of students working in addition to studying has been relatively stable since 2000. From 2004 to 2005 however, the proportion in short-cycle higher education increased from 76 % to 80 %. The number of students complementing their income by student loans has fallen since 2002 regardless of education. Although a decreasing proportion of the students take student loans, the average amount that is borrowed has increased irrespective of education programme. For instance, students in a bachelor education borrowed an average of DKK 25,600 in 2005 compared to an average of DKK 21,300 in 2000 (figure 6.6). Since 2000, there has been a general increase in the students average gross income, which is the total income excluding student loans. Students in short-cycle higher education, however, experienced a small decrease from 2000 to 2001, while students in university bachelor and masters programmes (candidatus) experienced a small decrease from 2001 to 2002 (table 6.11). Figure 6.7 shows the percentage development in average gross income compared to the development in the consumer price index. For students in professional bachelor programmes, the increase in average gross income has been above the increase in the consumer price index during the period concerned. On the other hand, the average gross income of students in short-cycle higher education programmes was steady from 2000 to 2002, whereupon it increased until 2005 when it caught up with the consumer price index for the first time during the period concerned. For students in university bachelor education programmes, the average gross income was steady from 2001 to 2003 at which time it again began increasing. The same development is largely observed for students in the twostep masters programmes (candidatus), although in this case there was a decrease from 2001 to 2002. Figure 6.6. Average amount of student loan for 18-29 year old students in non-paid education who receive student loans, current prices DKK
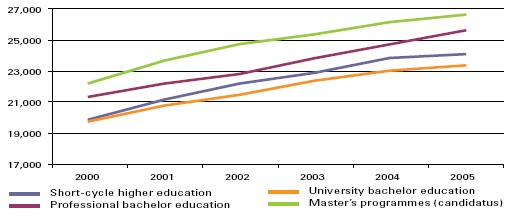
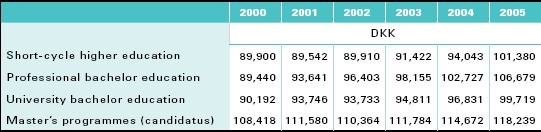
Table 6.11. Average gross income for 18-29 year old students in nonpaid education, current prices DKK
Figure 6.7. Development in the average gross income of 18-29 year old students in non-paid education, index
Footnotes5) Corresponds to a designated duration of three years because the start is usually in September and graduation in May.
|
||
|
To the top of the page |