|

Facts and Figures 2007Key Figures in Education 2007
Resumé Facts and Figures 2007 is an outline of the Danish education system with a quantitative description of trends and developments in various fields of education.
Contents:1 Introduction Complete table of contents Ministry of Education © Ministry of Education 2008
Tabel of contents
1 Introduction
1 IntroductionFacts and Figures 2007 gives an overview of the Danish education system and a quantitative description of the development within most of the various fields of education. The education system is changing continuously keeping up with new generations and new requirements from the labour market. This publication presents a series of key figures in tables and graphs showing the directions of the development. Primarily, the publication illustrates the development by Danish figures complemented by equivalent figures from selected countries. Most of the figures presented in the publication are also shown on the web site of the Danish Ministry of Education: www.uvm.dk. More information may also be found there about the various subjects. Key figures for education in Denmark are updated continuously, and in some cases previously published data is adjusted. For this reason, care should be taken when comparing the figures in this publication with the figures in previous publications.
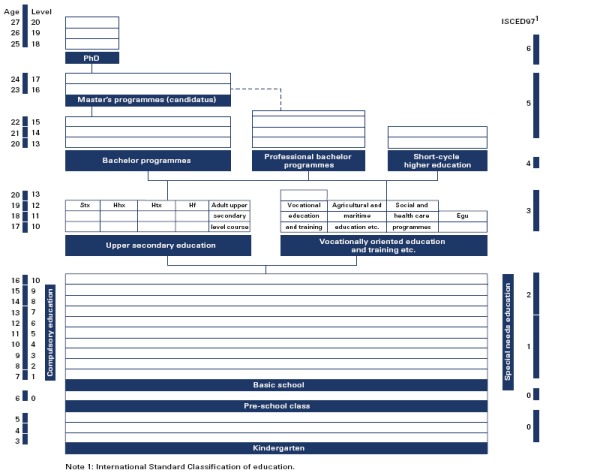
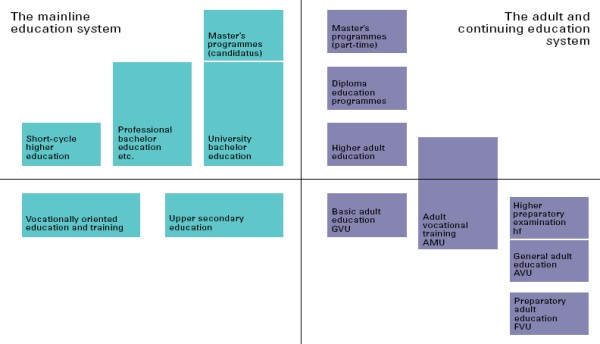
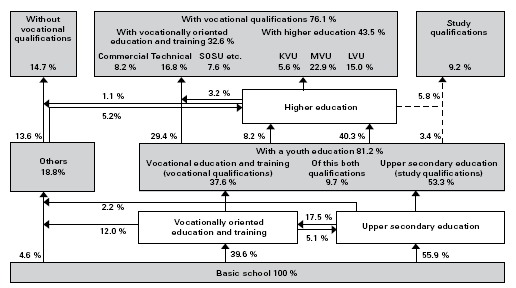
2 The education systemThe Danish education system may be divided into groups according to qualification level and field. Some education programmes give qualifications to further studies. This is frequently called study qualification. Other programmes give labour market qualifications called vocational qualifications. There are education programmes that provide both forms of qualification. Moreover, there are educations that do not provide any formal qualifications. The education system is divided into the mainline education system and an adult and continuing education system. Figure 2.1 and 2.2 show the structures of and the connections between the mainline education system and the adult and continuing education system. During recent years, the further education system for adults has undergone a structural adaptation so that its education levels are now directly comparable with the mainline education system. In the following section, the education system is reviewed together with the framework, the contents, and the aims that apply to its various areas.
Figure 2.1. The mainline
Figure 2.2. The parallel education system 2.1 The mainline Danish education system
The basic school (primary and
lower secondary school) Almost all children begin their schooling in a one-year pre-school class that in most schools is an integral part of the school start progression. The pre-school class is optional for the pupils, but must be offered by the municipalities. There are nine years of basic school. The basic school gives admission to youth education; however, the pupils may choose to continue in a 10th form. A little less than half of the pupils in the 9th form of the basic school elect to continue in the 10th form; however, this proportion has been diminishing in the recent years. The basic school comprises various types of schools. The municipal basic school including special schools by far covers the teaching of the majority of the pupils. The municipal basic school is a free offer to parents. The private basic schools and the continuation schools are alternatives to the municipal basic schools. Continuation schools are private boarding schools that typically offer teaching at the 8th through 10th form level. The private basic schools and the continuation schools are self-governing institutions financed by state subsidies and pupil contributions. In the year 2005, there were 712,100 pupils in basic school. Of these, 596,300 pupils attended a municipal basic school. The private basic schools had 90,800 pupils, while 24,900 pupils attended a continuation school. According to the Basic School Act, the purpose of the municipal basic schools is to bring to the pupils, in cooperation with the parents, knowledge and skills that: Prepare them for further education and give them the desire to learn more, familiarize themselves with Danish culture and history, provide them with an understanding of other countries and cultures, contribute to their appreciation of the interaction between man and nature, and promote an all-round development of the individual pupil. Pupils in the municipal basic schools are normally taught in classes that remain together throughout the entire course of the basic school. The teaching is differentiated within the framework of the class so that the teaching is based on the requirements and qualifications of the individual pupil. The private basic schools offer teaching to children in the age bracket of compulsory education, and it must measure up to what normally is required in the municipal basic schools; however, the framework for planning the teaching is more open. There are a few other forms of school that offer teaching at the basic school level. There are for example special schools for children, schools in connection with daytime therapy, therapeutic institutions, and parts of the municipal youth school offers. Some pupils have so great physical and psychical difficulties that their education cannot be dealt with in the regular teaching. Therefore, they receive special needs education. Until the 1st of January 2007, there were two forms of special needs education: the general special needs education, which was the responsibility of the municipalities, and the extensive special needs education, which was the responsibility of the counties. In the year 2005, approximately 13,800 pupils attended general special needs education, and 11,500 pupils attended extensive special needs education. Today, all special needs education is the responsibility of the municipalities, and it is no longer split up in general and extensive special needs education. In the international ISCED97 classification, the pre-school class corresponds to level 0, and the basic school corresponds to level 1 (1st through 6th form) and level 2 (7th through 10th form). Youth education Youth education includes the upper secondary education and the vocationally oriented education and training programmes. The youth education may prepare the students for further studies or for a profession or both. In either case, the emphasis is on developing the personal, professional, and theoretical qualifications of the students. Most youth education takes approximately three years; however, the duration may be anywhere from one year and a half and up to more than five years. Through a differentiated offer and planning of the education, the individual skills and wishes of the students may largely be taken into consideration. The purpose is to secure a high level of motivation so as many young people as possible complete the education. The latest calculations based on the educational behaviour in 2005 show that 81 % of a youth cohort are expected to complete a youth education. It is the goal of the government that at least 85 % of a youth cohort complete a youth education in the year 2010 and at least 95 % in 2015. On the 1st August 2007, new legislation took effect to give young people with special needs who cannot complete an ordinary youth education a legal right to a three-year course of education.
Upper secondary education All pupils who have received the relevant instruction and have passed the prescribed tests in the basic school may continue to an upper secondary youth education, unless the dismissing school appraises that the pupil has made the choice on an inadequate or unrealistic basis. In this case, the pupil is entered for an entrance examination. Stx, hhx, and htx are three-year education programmes with a common half-year foundation course followed by two and half years in a programme chosen by the student. Within certain limits, the schools themselves plan which programme should be offered to the students. Hf is offered as a two-year youth education programme as well as a programme for adults composed of single subjects. Hf comprises mandatory subjects and optional subjects; this gives the opportunity to put together an individual education programme. Hf is intended as a youth education offer to somewhat older students. It is not possible to go from the basic school 9th form directly to hf. Hf is frequently offered together with stx in upper secondary schools, while hhx and htx are offered in vocational schools. For many years, vocational schools have been selfgoverning institutions financed by the government. Following the municipal reform, which took effect the 1st January 2007, the upper secondary schools have been transferred from the counties into self-governing institutions financed by the government. There are a small number of private upper secondary schools and adult upper secondary level courses where the students pay a part of the tuition. The final examination completing an upper secondary education qualifies to enter higher education. However, the higher education programmes may pose requirements concerning subjects, level and the grade obtained.
Vocationally oriented education
and training All vocationally oriented education and training programmes give formal vocational qualifications. The education is also intended to prepare the students for a higher education. Normally, the only requirement for admission to a vocationally oriented education and training programme is that the applicant has completed the compulsory education in the basic school. Some of the vocational schools have a proportion of adult students, especially in case of social and health care training programmes. The vocational education and training programmes (EUD) account for the greater part of vocational youth education. The total duration of a vocational education and training programme is between one and a half years and five and a half years. However, the norm is three to four years. Vocational education and training is a multitude of diverse programmes. As of 1st January 2007, it consists of about 120 programmes in the commercial and technical fields. There are seven entry points into vocational education and training, each consisting of a base course of study and a main course of study as well as a practice period. For the individual student, the base course of study may be substituted fully or partially by basic, practical training in an enterprise based on a training contract. In order to plan the course of education individually, each student together with the school and the business enterprise where the practice takes place shall develop a personal education plan. A vocational education and training programme starts either in a school that is normally the case or in practice. In EUD, there is free admission to the base course of study, and entry is continuous. In total, approximately 30-50 % of the time is spent in school and 50-70 % in the practice enterprise or in school practice organized by the vocational college if it is not possible to get a sufficient number of practice placements in enterprises. Vocational education and training is undergoing change. With a reform as of 1st August 2007, a common legislative framework for vocational education and training, basic social and health care training programmes, and agricultural education has been created. The purpose of this education has been adjusted; increased emphasis is placed on internationalization and education guarantee, and the effort against dropouts is intensified. The seven common entry points are replaced by 12 common entry points, and the base course of study is remodelled so that both students with weak study qualifications and students with strong study qualifications are benefited. There will be better opportunities for dividing the education into steps and levels and for individual courses of study. The effort to gain more practice placements and the quality of school practice will be strengthened. The present education programmes will continue in a transitional period. The new entry structure has been implemented, and the new education programmes have been developed. Students under 25 years of age who have already completed the first step of an education may return after a minimum of half a year of relevant vocational experience to complete the education in a course of study called EUD+. Adults over 25 years of age with vocational experience in the field in question have the opportunity to complete the course of study in a shorter time based on an appraisal of their prior learning and a subsequent crediting of competencies. If the requirement of two years of relevant vocational experience is met, this may take place as a basic adult education (GVU). A relevant vocationally oriented education and training programme gives admission to a number of shortcycle higher education programmes and certain professional bachelor programmes. Social and health care training programmes (SOSU), like the alternating EUD programmes, consist of a combination of practice and school studies. The SOSU programmes comprise the social and health care helper education (one year and two months) as well as an extension to social and health care assistant (one year and eight months). The admission requirement to the education for social and health care helper is the completion of the basic course of study or other relevant trade experience. The social and health care training programmes also include the educational childworker and care assistant training (PGU). The PGU programme qualifies the students for pedagogical and care-related work with children, young people and adults as pedagogy assistants, registered child minders and special needs care assistants etc. The duration of PGU is seven and one half months. The admission requirement is a basic SOSU course of study or other vocational or teaching experience. After the basic course of study, the education is undertaken based on an employment contract between the student and an engaging municipal authority. Furthermore, within the field of vocationally oriented education and training, there is a series of vocational agricultural and maritime education programmes. The duration of the skilled farmer education is three and a half years and alternates between practice and school. Maritime education comprises for example able seaman, fisherman, coastal shipmaster, etc. The basic vocational education and training (egu) is an individually planned offer of education to young people under 30 years of age who do not qualify directly for another youth education leading to formal qualifications. The course of study is primarily based on practice and alternates between time in school and time in practice. The duration of this education is normally two years; however, it may be extended by an additional year of practice. In total, the time in school is from 20 to 40 weeks, and normally consists of courses from the established education programmes, for example the vocational education and training programmes, the adult vocational training programmes, the social and health care training programmes, or the agricultural programmes. The periods of practice take place in one or more enterprises or as workshop practice in a technical school, a production school or similar. A completed egu education provides vocational qualifications and the opportunity to continue in a general vocational education and training programme with credit transfer. The youth education programmes comprise level 3 of the ISCED97 classification. Production schools The purpose of this education is to strengthen the students personal development and to improve their opportunities in the education system and in the general labour market. The offer is planned with the specific aim that young people acquire qualifications that may result in the completion of a vocationally qualifying youth education. The education programme is based on activities in diverse workshops and comprises practical work and performance of tasks in combination with theoretical training in actual production and marketing. Furthermore, the schools offer teaching in general subjects so the students are prepared to start a general youth education. Up to one third of the course of study in a production school may be spent on studies in other educational institutions. For example, these may include studies of general subjects in an adult education centre (VUC) or parts of a basic course of study in a vocational college. Furthermore, the students may participate in practice for four weeks each semester. Higher education The latest calculations based on the educational behaviour in 2005 show that 44 % of a youth cohort will complete a higher education. It is the goal of the government that at least 45 % of a youth cohort complete a higher education in the year 2010 and at least 50 % in 2015. As a rule, higher education is free in Denmark. However, the students normally pay for books and other teaching materials. For most higher education, the schools themselves decide how many student seats are established. For some education programmes, however, the number of student seats is decided centrally; this is the case for the medical, veterinary, and dentistry schools. To be admitted to a higher education, the applicant must meet the entry requirements demanded by the school in question. For example, in order to be admitted to a university bachelor education programme, the applicant must meet the entry requirement of a general upper secondary graduation diploma including certain upper secondary subjects at a specified level. Furthermore, some bachelor programmes require that the upper secondary exam be passed with a certain minimum mark in average or in individual subjects. A vocational academy education is a short-cycle higher education that as a rule takes two years. These education programmes are often directed towards a specific trade or job function, and they combine theory and practice. The requirement for admission to a vocational academy education is an upper secondary education or a vocationally oriented education, typically complemented by requirements of certain academic levels in mathematics and English. Today, there are ten technical and eight commercial vocational academy education programmes and three other short-cycle higher education programmes (pharmacy assistant, transport logistician, and offshore technical manager). Short-cycle higher education may give admission to relevant diploma education programmes. A professional bachelor education is a profession-oriented, qualifying medium-cycle higher education. The programmes for professional bachelor education normally take three to four years including a minimum of half a year of practice. A professional bachelor education combines theory and practice and is most often directed towards a certain trade or job field. The entry requirements for the professional bachelor programmes are in most cases a general upper secondary education (whole or in parts); however, certain vocational education and training programmes (EUD) complemented by general upper secondary courses also provide admission. Today, there are approximately 30 professional bachelor education programmes within health care, biotechnology, laboratory technology, media and communication, pedagogy, technology, social sciences, and economics. A professional bachelor education provides admission to relevant masters programmes (candidatus) and masters programmes (part-time). The greater part of the professional bachelor education takes place at centres for higher education (CVU). Starting 1st January 2008, the present CVUs and seven individual institutions among the medium-cycle higher education schools enter into eight university colleges for higher education. Among other medium-cycle education programmes, there are for example: fine arts education, maritime/navigation education, sign language interpreter, armed forces education, etc. The duration of these programmes varies. At the same level as the professional bachelor education programme, there is the three-year bachelor education programme in the universities. The bachelor education is a complete education giving vocational qualifications as well as access to a twoyear masters programmes (candidatus). The current structure of the university education was established in 1993 when it was decided to divide the long-cycle university education programmes leading to a masters degree (candidatus) into two shorter courses of study: a bachelor course of study and a masters (candidatus) course of study. Formerly, there had been only the complete course of study leading to the masters degree (candidatus) as the first academic degree. Today, all long-cycle higher education programmes in university consist of a three-year bachelor programme followed by a two-year masters programme (candidatus). Henceforth, the education may be extended further by a three-year PhD programme (the so-called 3+2+3 model). As a rule, the entry requirement for the bachelor programmes in university is a general upper secondary education plus possibly meeting specific requirements for course subjects and level. Admission to the masters programmes (candidatus) presupposes a relevant bachelor degree or another relevant Danish or foreign education at the same level. As a superstructure to the masters programmes (candidatus), there is a research education leading to a PhD degree. This education is normalized to three years of full-time studies. The programme includes the completion of an independent research project under supervision and the preparation of a written thesis based on the PhD project, the completion of research courses corresponding to approximately 30 ECTS points, participation in active research environments through residences in other, primarily foreign, research institutions, as well as acquiring experience in teaching or another form of communication skills. The entry requirement to a PhD programme is normally a masters degree (candidatus), although it is possible to be admitted before the masters programme (candidatus) has been completed. It must be ensured, however, that the combined course of study has the same magnitude and is at the same level as if the PhD programme were started after the completion of the masters degree (candidatus). The higher education programmes comprise level 5 of the ISCED97 classification. The PhD education is considered level 6 in the ISCED97 classification.
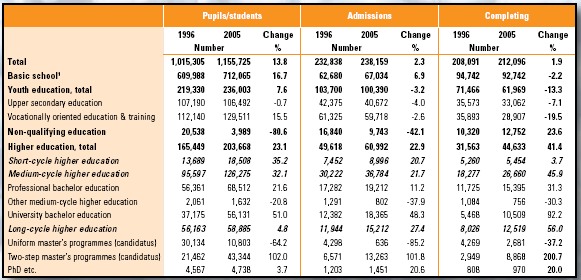
Pupils/students and educational
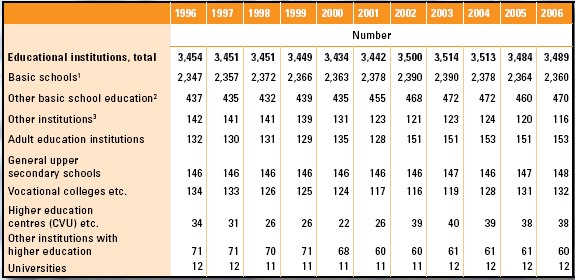
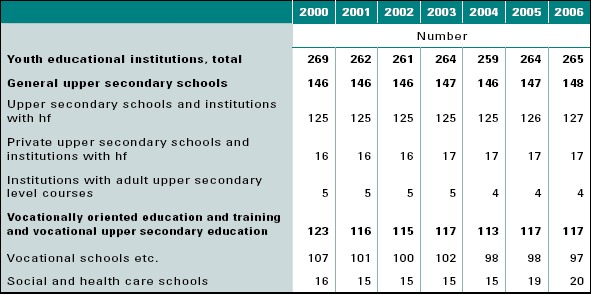
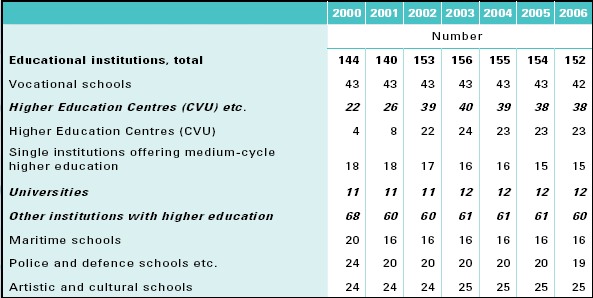
institutions within regular education Table 2.2 shows the development in number of educational institutions over a period of ten years. The table shows the juridical units that means main schools and independent institutions. Main schools are administrative units. Each main school has one or more subdivisions. Table 2.1. Number of pupils/students in the Danish education system, and number of admissions and pupils/ students completing the education programmes, 1996 and 2005
Table 2.2. Number of educational institutions
2.2 The adult and continuing education systemDenmark has a long tradition of popular enlightenment and adult education. Adult and continuing education (VEU) may be divided in three categories: formally qualifying education, education not formally qualifying, and private courses. Formally qualifying adult and continuing education may be divided into general and vocational education programmes. Among other things, the adult education programmes comprise: Preparatory adult education (FVU) with the purpose to give adults the opportunity to complement their basic skills in reading and mathematics. Both subjects are divided into steps, and it is possible to submit to a test after each step. General adult education (AVU) is an offer to adults over 18 years of age to improve their knowledge in a series of general subjects, for example Danish, mathematics and social studies. AVU may be concluded with tests corresponding to the 9th and 10th form in the basic school. Higher preparatory single subject course (single subject hf ) with the purpose that adult participants achieve a general education, knowledge, and qualifications forming the basis for further education or increasing their opportunities in the labour market. Single subject hf may be concluded with tests corresponding to the general upper secondary levels. Among other things, the vocational adult and continuing education programmes comprise: Adult vocational training (AMU) consisting of approximately 3,000 different adult vocational training programmes and a selection of single subjects from vocational education and training programmes leading to distinct qualifications to perform unskilled and skilled tasks. Adult vocational education and training is special adult courses of study within the ordinary vocational education and training. Basic adult education (GVU), which is the framework in which previous education and relevant trade experience, complemented with elements of vocational education and training and adult vocational training courses (AMU) among other things, are combined into a formal vocational education and training programme. The continuing education system for adults (VFV), which comprises higher adult education (VVU) as well as diploma and masters programmes (part-time), provides qualifications at the same level as bachelor, respectively masters programmes (candidatus). Open education programmes aim to further a wide spectrum of vocationaloriented education offers to the adult population and comprise among other things part-time education, single subjects, and subject-specific courses. Among education programmes not giving formal qualifications, there are studies in evening classes, folk high schools and day folk high schools. The scope of the studies within various types of adult education varies from a few hours to complete full-time courses of study of several years duration. The courses are normally taken on a part-time basis. A part of the courses in the open education programme takes place as distance learning. The adult education programmes may be publicly and/or privately financed. In parts of the public area, a principle of student payment in part has been introduced. In certain education programmes, the state provides a subsidy for living expenses. Adult and continuing education completed with a consolidated qualification, for example single subject hf and diploma and masters programmes (part-time) are placed at level 3-5 in ISCED97 classification and are counted in the international statistics (Education at a Glance). Standalone single subjects and AMU courses are not counted.
Prior learning The appraisal of prior learning will be implemented during the course of the years 2007 and 2008. After that time, all individuals will have the opportunity to have their prior learning appraised and acknowledged. The appraisal will take place in an educational institution and in relation to the education program to which the individual wishes to be admitted, to have shortened, or to have certified. This scheme will come into force for all adult and continuing education up to and including the diploma level. For the individual, an appraisal of prior learning may be used to meet entry requirements to an education programme, to shortening or individually planning a specific education or to obtain certification of parts of an education programme.
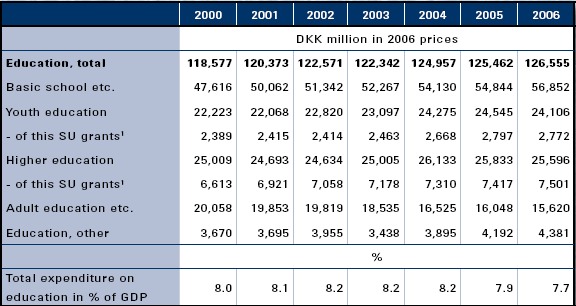
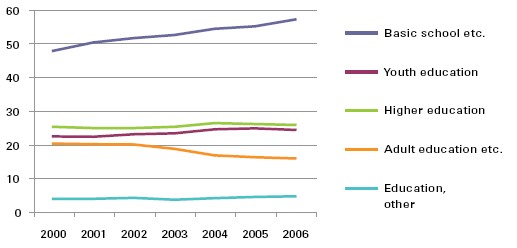
3 FinancesThe 2006 total public expenditure on education amounted to DKK 126.6 billion, corresponding to 7.7 % of the gross domestic product. From 2000 to 2004, the expenditure increased in real terms as well as in proportion of the gross domestic product. 3.1 Total public expenditure on educationThe 2006, total public expenditure on education amounted to DKK 126.6 billion, corresponding to 7.7 % of the gross domestic product (GDP). From 2000 to 2006, the expenditure on education increased by a good 6 % in real terms. Since the increase in GDP has been greater than the increase in total public expenditure on education, the total expenditure on education as a percentage of the GDP decreased from 2004 to 2006. The biggest share of the expenditure on education goes to the basic school where at the same time the biggest increase in expenditure was seen well over 16 % from 2000 to 2006. In 2006, the basic school expenditure amounted to a total of DKK 56.9 billion. This includes municipal and private basic schools, continuation schools, and youth schools, etc. The expenditure on youth education grew from DKK 22.2 billion in 2000 to DKK 24.1 billion in 2006 corresponding to an increase of nearly 8 %. This includes an increase of 14 % of the expenditure on student grants. The expenditure on higher education increased by 2.3 % from 2000 to 2006. In the year 2006, a total of DKK 25.6 billion was spent on higher education. The category Adult education etc. comprises expenditure on adult education, Danish lessons for immigrants, production schools, popular enlightenment, folk high schools together with state expenditure on adult and continuing education. In 2006, these expenses amounted to a total of DKK 15.6 billion. Figure 3.1 is a graphic representation of the development in public expenditure at various levels of education. Table 3.1. Public expenditure on education distributed by level of education
Figure 3.1. Development in public expenditure distributed by level of education, DKK billion in 2006 prices
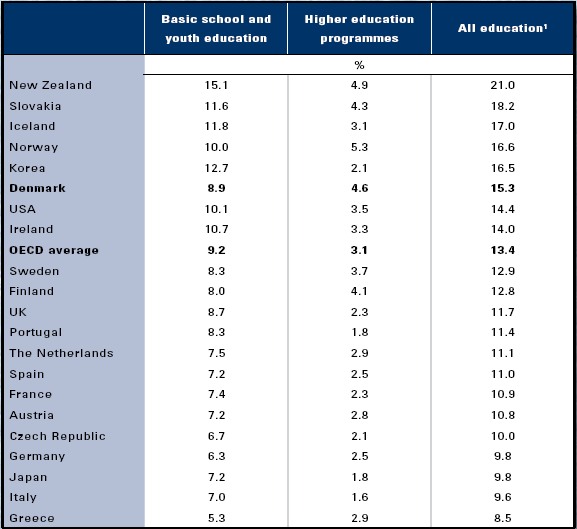
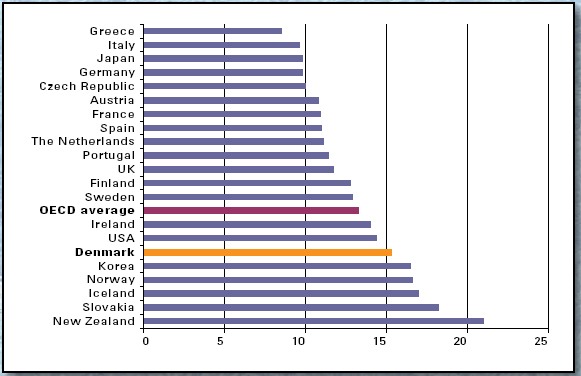
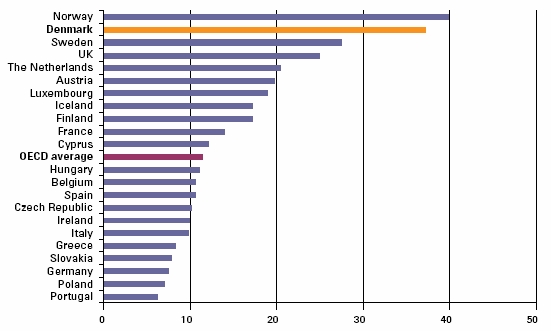
3.2 Public expenditure on education as a percentage of total public expenditure in Denmark and selected countriesThe 2004 public expenditure on education was 15.3 % of the total public spending. This is slightly over the OECD average. The expenditures in these statistics comprise all public expenditure on education including student grants etc. In 2004, Denmark used 15.3 % of the total public expenditure on education (table 3.2). This puts Denmark slightly over the OECD average of 13.4 %; countries such as New Zealand, Norway, and Korea used a larger share of the total public expenditure on education (17-21%). In 2004, the public expenditure on basic school and youth education amounted to 8.9 % of the total public expenditure in Denmark. This is a little less than the corresponding OECD average of 9.2 %. In some countries, the expenditure on the basic school and youth education is somewhat higher than in Denmark. For example, this is the case for New Zealand (15.1 %), Korea (12.7 %) and Iceland (11.8 %). In 2004, public expenditure on higher education amounted to 4.6 % of the total public expenditure in Denmark. This places Denmark over the corresponding OECD average of 3.1 %. Only New Zealand (4.9 %) and Norway (5.3 %) spend larger shares on higher education than Denmark. The large expenditure on higher education in Denmark may partly be ascribed to the relatively large spending on financial support. To some extent, the distribution of the expenditure reflects the composition of the population. Figure 3.2 shows the total public expenditure on education in proportion to the total public expenditure. Table 3.2. Public expenditure on education as a percentage of total public expenditure in Denmark and selected OECD countries, 2004
Figure 3.2. Total public
expenditure on education
(all programmes)
compared to total public
expenditure, in Denmark
and selected OECD
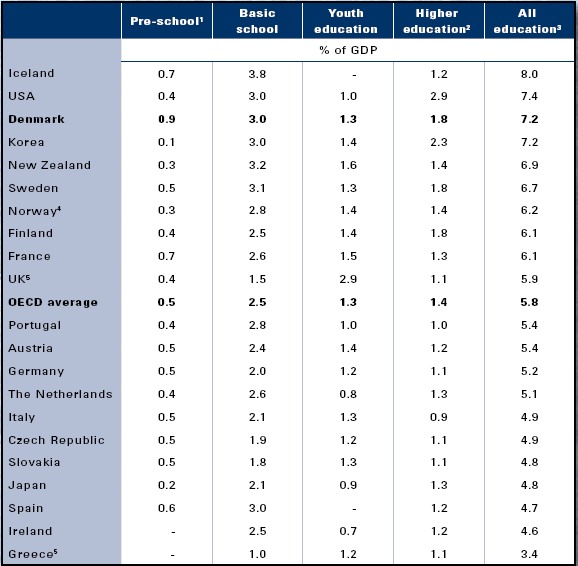
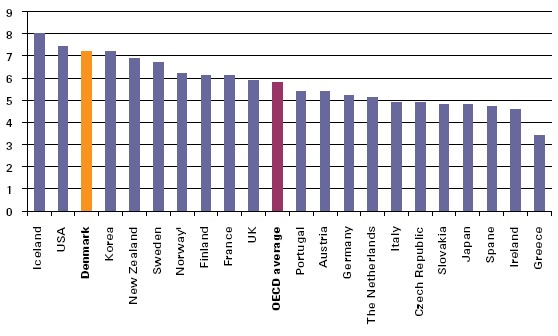
countries, 2004, percent 3.3 Total public and private expenditures on educational institutions in Denmark and selected countriesCompared to other countries, Denmark uses many resources on educational institutions at all levels. In the year 2004, the total expenditure (public and private) on educational institutions in Denmark amounted to 7.2 % of the gross domestic product. In 2004, the total public and private expenditure on educational institutions in Denmark amounted to 7.2 % of the gross domestic product. The corresponding OECD average was 5.8 % (table 3.3). Thus, the total Danish expenditure was only surpassed by Iceland (8.0 %) and USA (7.4 %). The statistic only covers expenditure on educational institutions, so disbursements for public transfer income such as state education grants are not included. The majority of the countries spend the most money on basic school. However, the distribution of expenditure between the various education levels depends on the demography of each country. In particular, when compared to other countries, the expenditure on pre-school (kindergarten and preschool class) and basic school is high in Denmark. In 2004, expenditure on pre-school amounted to 0.9 % of GDP compared to an OECD average of 0.5 %. In Denmark, the expenditure on basic school amounted to 3.0 % of the GDP, while the OECD average was 2.5 %. In 2004, the Danish expenditure on youth education amounted to 1.3 % of the GDP, which was the same as the OECD average. In 2004, the expenditure in Denmark on higher education was 1.8 % of the GDP, whereas the OECD average was 1.4 %. In Korea and USA, the expenditure on higher education was high making up 2.3 % and 2.9 % respectively of the GDP. The total private and public expenditure on educational institutions at all levels show a wide variation among the OECD countries. Denmark is among the countries spending the most resources in relation to the GDP (figure 3.3). Table 3.3. Total public and private expenditure on educational institutions as a percentage of GDP in Denmark and selected OECD countries, 2004
Figure 3.3. Total public and private expenditure on educational institutions, all programmes, as a percentage of GDP in Denmark and selected OECD countries, 2004
3.4 Total public and private expenditures per pupil/ student in Denmark and selected countriesCompared to other OECD countries, Denmark spends many resources per pupil in basic school and youth education. Denmark also uses more than the OECD average per student in higher education. This statistic only covers expenditure on educational institutions; thus, disbursements for public transfer income such as state education grants are not included. In 2004, the expenditure per pupil in the 7th through 10th form of basic school was the equivalent of USD 8,224 per year. Thus, Denmarks expenditure per pupil was considerably above the OECD average (USD 6,909) For the 1st through 6th form, the expenditure was USD 8,081 per year, only surpassed by Norway and USA (table 3.4). In Denmark in 2004, the expenditure per pupil on youth education was USD 9,466, whereas the OECD average was USD 7,884. In Norway, France, Germany, Austria, and USA, however, the expenditure per pupil was higher with Norway spending most (USD 12,498 per pupil). In Denmark in 2004, the average cost per student in higher education was USD 15,225 per year. The OECD average was USD 11,100. The cost in USA was more than twice the OECD average, that is USD 22,476 per student. The rightmost column of the table shows the total expenditure on basic school as well as youth education per pupil calculated based on the theoretical duration of the education programmes. The theoretical duration of the education programmes is 12-13 years in 29 of 34 OECD and partner countries1 (does not emerge from the table). The education programmes are therefore relatively of the same duration. In spite of this, there is a big variation in the total expenditures. In 2004, the expenditure per student varied from less than USD 60,000 in Greece, the Czech Republic, and Slovakia to more than USD 100,000 in Norway, USA, Denmark, and Austria There is a certain uncertainty to this kind of statistic; however, the numbers reflect factual differences in the way in which the countries prioritize resources for the various education levels. Table 3.4. Total public and private expenditure per pupil/student per year in Denmark and selected OECD countries converted using PPP1 in USD, 2004
There is a relatively wide variation in the expenditure per pupil/student at all educational levels in the OECD countries. For example, the expenditure varies from approximately USD 2,000 to just under USD 9,000 per student in 1st through 6th form (figure 3.4). Figure 3.4. Total public and private expenditure in USD per pupil in 1st through 6th form, in Denmark and selected OECD countries, 2004
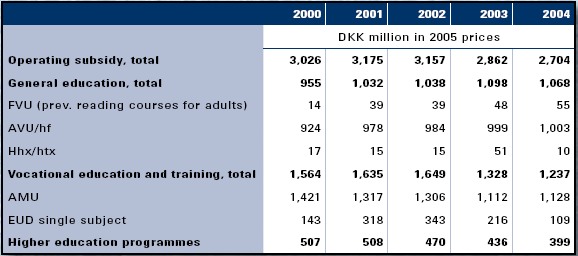
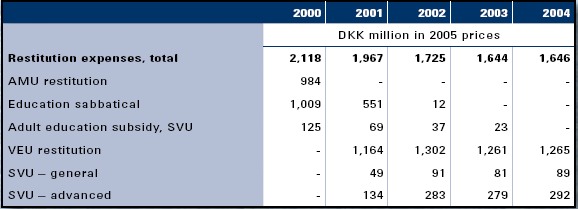
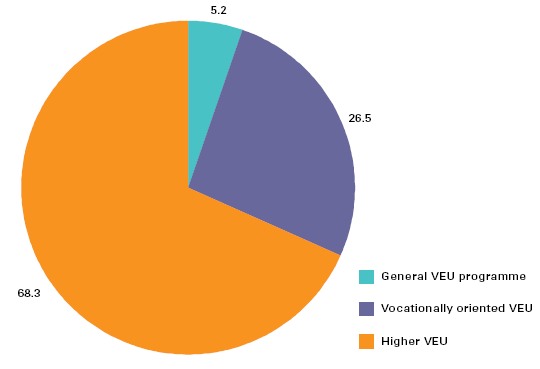
3.5 Public expenditure on adult and continuing educationThere are adult and continuing education offers within general, vocational, and higher education that receive public operating subsidy. The public operating subsidy for adult and continuing education amounted to DKK 2.7 billion in 2004. In 2004, the public operating subsidy for adult and continuing education (VEU) amounted to a total of DKK 2.7 billion in 2004. The operating subsidy to the general education programmes was DKK 1.1 billion in 2004 (table 3.5). The general education programmes comprise the preparatory adult education (FVU), general adult education (AVU) and upper secondary education (single subjects within the higher preparatory courses (single subject hf ), the higher commercial examination (hhx), the higher technical examination (htx), and upper secondary school leaving examination (stx).Vocational-oriented VEU only includes the adult vocational training programmes (AMU) and single subject EUD etc. In 2004, the operating subsidies to these amounted to DKK 1.2 billion with just over 91 % going to AMU. The higher education programmes include single subjects in short-, intermediate-, and long-cycle higher education programmes. Additionally, there are short-cycle and intermediate-cycle higher education programmes directly under open education programmes such as the market economist education and the datamatician education as well as the merit teacher and merit pedagogue education or diploma and masters programmes (part-time). In 2004, the operating subsidies to higher education amounted to DKK 0.4 billion. From 2000 through 2004, the public operating subsidies decreased by 11 %, which should be viewed in the light of rationalizations following institution mergers, transition to increased demand control via user payment, introduction of subsidy ceilings, harmonization of fees, and a change in the composition of the education activity. There are various possibilities for compensation of loss of income during the education. In addition to operating subsidies to the amount of DKK 2.7 billion in 2004 in connection with carrying out the VEU activities, the participants were paid compensation in the amount of DKK 1.6 billion. From table 3.6, it emerges how the reforms in the area have changed the possibilities for compensation. Education leave and the so-called AMU compensation have been phased out, and a VEU compensation was introduced starting from the year 2001. The disbursement of DKK 1.3 billion for VEU compensation in 2004 concerns persons who participate in a vocationally oriented VEU up to and including the vocational education and training level. This includes AMU. The disbursement for VEU compensation amounts to 77 % of the total cost of compensation for loss of income. The state adult education grants (SVU) are apportioned with DKK 0.1 billion to the general SVU, which concerns the general education programmes, and DKK 0.3 billion to the higher SVU, which is allotted to persons seeking adult and continuing education within higher education programmes. Figure 3.5 shows the distribution of tuition paid by students in each type of VEU. Of the total student paid tuition of DKK 676 million in 2004 (not shown in the diagram), the students in higher VEU paid DKK 462 million corresponding to 68 % of the total student paid tuition, while the students in vocational-oriented VEU paid DKK 179 million, and the students in the general VEU programme paid DKK 35 million corresponding to 5 %. Table 3.5. Public operating subsidy per type of VEU
Table 3.6. Restitution expenses
Remark: The table does not include
expenditure on popular enlightenment
(folk high schools, evening courses and
day folk high schools), special needs
education for adults or expenditure on Danish courses for foreigners.
Figure 3.5. Distribution as a percentage of student paid tuition in VEU education, 2004, in 2005 prices DKK
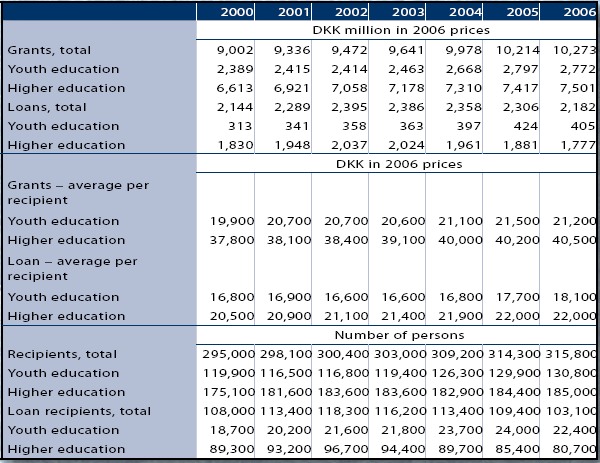
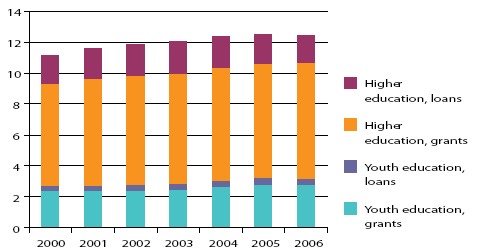
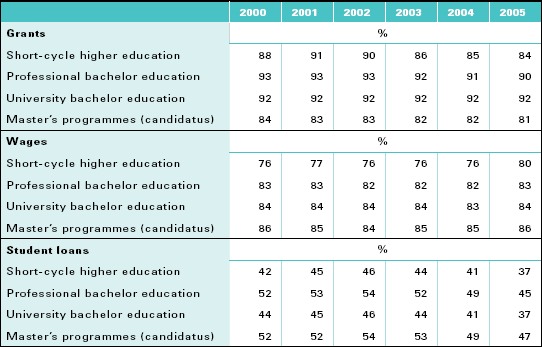
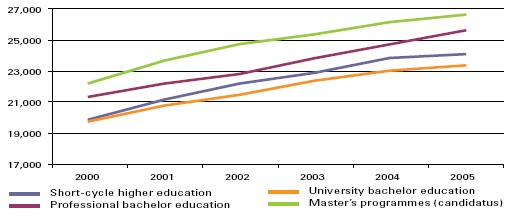
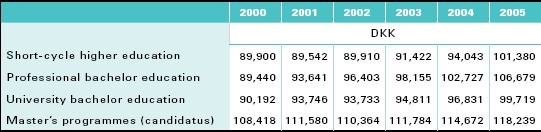
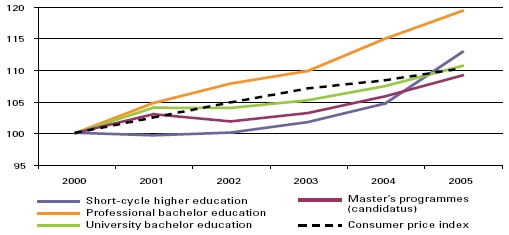
Source: Livslang opkvalificering og uddannelse for alle på arbejdsmarkedet, 2006 [Lifelong upgrading of qualifications and education for everyone in the labour market, 2006]. 3.6 Expenditure on the State Education Grant and Loan SchemeIn 2006, the State Education Grant and Loan Scheme disbursed DKK 12.5 billion in grants and loans to pupils and students. 75 % of the expenditure on education grants went to higher education students. The state education grants and loans are administered on a monthly basis. There are di erent rates of grants for students living at home and students living away from home, whereas the loan rate is the same. Loans are only allotted in connection with a grant. The students are allowed to have a monthly income in the form of salary in addition to the grant. In 2006, the total allocation of grants and loans from the State Education Grant and Loan Scheme amounted to DKK 12.5 billion. Of these, DKK 10.3 billion were allotted as monthly grants to 315,800 persons, while the rest was allotted as loans (table 3.7). From year 2000 through 2006, the expenditure on grants from the State Education Grant and Loan Scheme rose by 14 % from DKK 9.0 billion to DKK 10.3 billion. During the same period, the number of grant recipients grew from 295,000 to 315.800 corresponding to a 7 % increase, whereas the number of loan recipients fell from 108,000 to 103,100 corresponding to a decrease of nearly 5 %. In 2006, the average grant recipient in youth education received grants in the amount of DKK 21,200, whereas a grant recipient in a higher education programme received an average of DKK 40,500 per year. In 2006, loan recipients in a higher education programme borrowed an average of DKK 22,000, while loan recipients in youth education borrowed an average of DKK 18,100. The number of loan recipients in higher education is approximately four times the number of loan recipients in youth education. As seen from figure 3.6, there has been an increase over the recent six years in the total expenditure on the State Education Grant and Loan Scheme. However, the growth seems to have stopped at a level where the total expenditure corresponds to just short of DKK 13 billion. Furthermore, it is noted that most is spent on higher education both for loans and grants. The proportion spent on loans to students in youth education is relatively modest. Table 3.7. Expenditure on the State Education Grant and Loan Scheme
Figure 3.6. Expenditure on grants and loans for youth education and higher education, DKK billion in 2006 prices
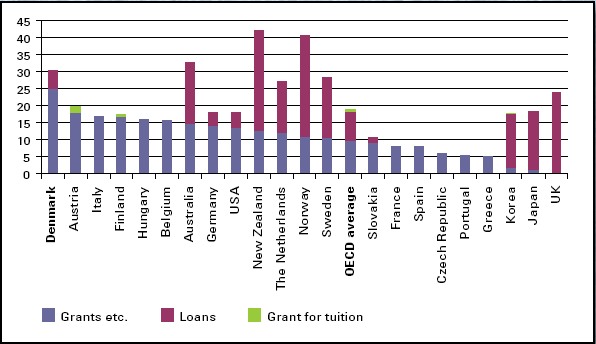
3.7 Expenditure on financial support of students in higher education in Denmark and selected countriesIn 2004, the OECD countries spent an average of 18 % of the total public expenditure on higher education on financial support to the students. Denmark spent 30 %. While expenditure on grants and other transfer income is sizeable in Denmark, relatively little is spent when comparing internationally on loans to students. In 2004 in Denmark, 5 % of the total public expenditure on higher education went to loans. The OECD average was just short of 9 %. There is a large variation in the amounts each country uses on grants and other transfer income and on loans. Denmark is the country that uses the most on grants and other transfer income. In 2004 in Denmark, 25 % of the total expenditure on higher education was spent on grants and other transfer income; this places Denmark in the very top. In average, the OECD countries spend approximately 10 % of the total expenditure on higher education on grants and other transfer income. Among the Nordic countries, Finland spends 17 % on grants and other transfer income, while Norway and Sweden are very close to the OECD average. Korea, Japan, and UK spend a very small share on grants and other transfer income, but a high proportion on loans. Note that this statistic on financial support includes not only the State Education Grant and Loan Scheme, but all forms of transfer income that is paid in connection with higher education, for example the State adult education support scheme (SVU), Adult and continuing education compensation (VEU), social security cash benefit, and rehabilitation. As seen from figure 3.7, there is a wide variation in the countries expenditure on loans. In Sweden and Norway, the students borrow approximately 18 % and 30 % respectively of their total expenditure on higher education. Overall, the students in over one third of the countries borrow considerably more than Danish students who, on the other hand, receive high grants and other transfer income. Note, however, that in some countries it is not possible to account for the loans. A few countries give grants to pay for tuition. For example, this is the case in Austria and Finland; however, this is not relevant for Danish students. Figure 3.7. Percentage of total public expenditure on higher education used for grants and other transfer income, loans, and grants for tuition in Denmark and selected OECD countries, by type of expenditure 2004
Footnotes1) Partner countries are primarily African, Asian, and South American countries that participate in the OECD/UNESCO cooperation but have not achieved full membership.
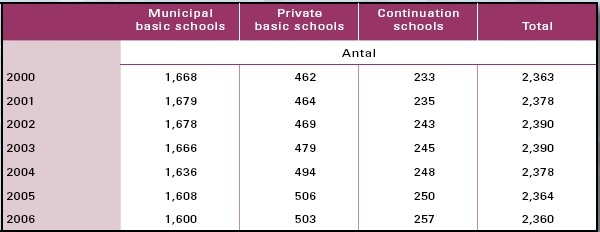
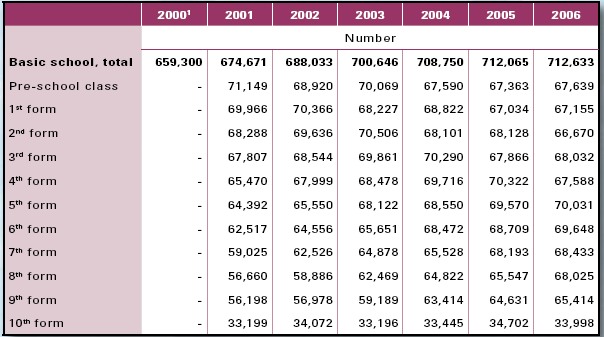
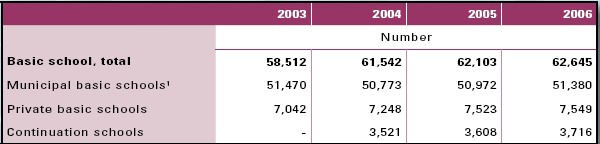
4 Basic school4.1 Number of schools and pupilsThe number of basic schools has decreased since 2000. At the same time, more pupils have come by. As a result, there are now more pupils in each school. In 2006, there were 2,360 basic schools comprised of 1,600 municipal basic schools, 503 private basic schools, and 257 continuation schools. Over the period as a whole, from the year 2000 through 2006, there have become fewer municipal schools, whereas the number of private basic schools and continuation schools has increased (table 4.1). Note that the year 2006 corresponds to the school year 2006/2007, just as 2000 corresponds to the school year 2000/2001. Additionally, there were 470 municipal youth schools, youth boarding schools, and special schools where teaching at the basic school level took place as well as 183 schools in connection with daytime therapy and therapeutic institutions. While the basic schools have become fewer, the number of pupils has increased steadily. From 2000 to 2006, the number of pupils in basic school increased from 659,300 to 712,600. This corresponds to an increase of 8 % (table 4.2). Table 4.1. Basic schools per type of school
Table 4.2. Number of pupils in basic school per form level
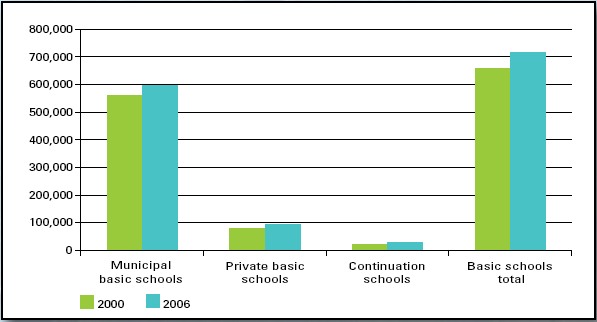
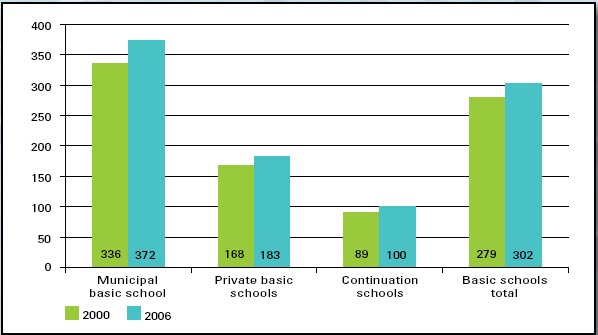
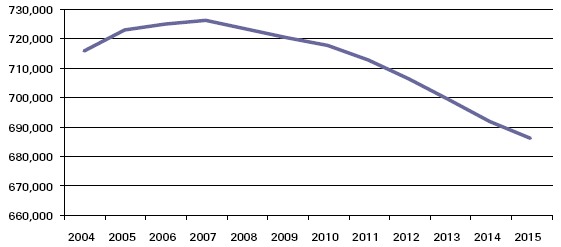
Figure 4.1 shows the number of pupils in basic school per type of school in 2000 and in 2006. Regardless of type of school, the number of pupils has increased. The continuation schools have 24 % more pupils, corresponding to an increase of 5,000 pupils, while the private basic schools have 19 % more pupils, corresponding to an increase of 14,500 pupils. In comparison, the municipal basic schools only have 6 % more pupils, although this represents an increase of 35,000 pupils. Fewer basic schools and more pupils have resulted in the average number of pupils per school having increased. As figure 4.2 shows, the largest numeric growth has taken place in the municipal schools that have experienced an increase of 36 pupils per school corresponding to 11 %. On the other hand, the continuation schools have had the highest increase by percent with 13 % more pupils per school (11 pupils). The anticipated development in number of pupils until 2015 is shown in the extrapolation in figure 4.3. It is seen that the number of pupils peaks in 2007 with 725,800. Then the total number of pupils will decrease steadily. Figure 4.1. Number of pupils per type of school, 2000 and 2006
Figure 4.2. Average number of pupils per school, 2000 and 2006
Figure 4.3. Extrapolation of the total number of pupils in all types of schools
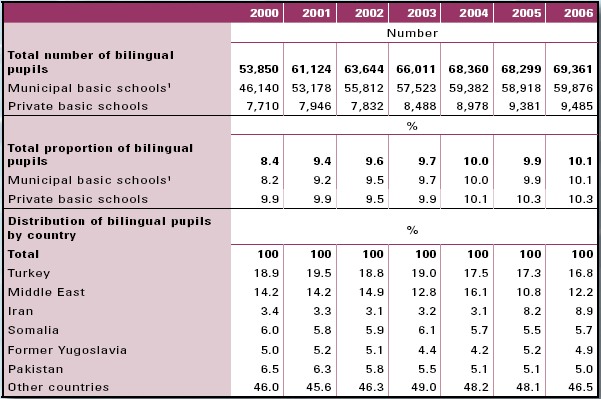
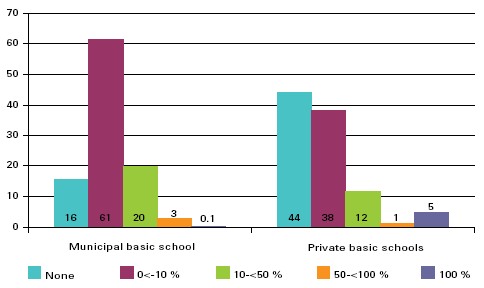
4.2 Bilingual pupilsThe proportion of bilingual pupils in the municipal basic schools and in the private basic schools has increased from 8 % in 2000 to 10 % in 2006. Primarily pupils with a family background from Turkey, the Middle East, and Iran make up the body of bilingual pupils. In 2006, a good 10 % of the pupils in basic school (excluding continuation schools) were bilingual. Bilingual pupils by definition are children who have a maternal language other than Danish, and who do not learn Danish until they come in contact with the surrounding community or through the teaching in school. From 2000 through 2006, the number of bilingual children increased from slightly less than 53,900 to 69,400, equivalent to a 29 % increase. Aside from a small decrease in 2005, the increase has been steady (table 4.3). The proportion of bilingual pupils in the private basic schools has generally been higher than the corresponding proportion in the municipal basic schools. Through the years, however, the two proportions have converged, and in the year 2006, both were a good 10 %. In municipal basic schools, the proportion of bilingual pupils corresponded to 59,900 pupils, while in the private basic schools it corresponded to 9,500 pupils. More than half of the bilingual pupils in basic school have a family background from Turkey, the Middle East, Iran, Somalia, the former Yugoslavia, or Pakistan. With 17 %, the largest group consists of pupils with a Turkish family background; however, this is a smaller proportion than in 2001 when that group made up 20 %. Since 2004, the proportion of bilingual pupils with an Iranian background has more than tripled from 3 % to 9 % in 2006. Regarding the distribution of bilingual pupils in municipal basic schools, the majority by far (77 %) of the schools have less than 10 % bilingual pupils. In comparison, a good 82 % of the private basic schools have less than 10 % bilingual pupils (figure 4.4). In 97 % of the municipal basic schools, less than half of the pupils are bilingual, and the same is the case for 94 % of the private basic schools. In 3 % of the municipal and in 1 % of the private basic schools, between half and 99 % of the pupils are bilingual. In 0.1 % of the municipal and in almost 5 % of the private basic schools, all pupils are bilingual. Table 4.3. Distribution of bilingual pupils in municipal and private basic schools
Figure 4.4. Proportion of bilingual pupils in municipal and private basic schools, 2006
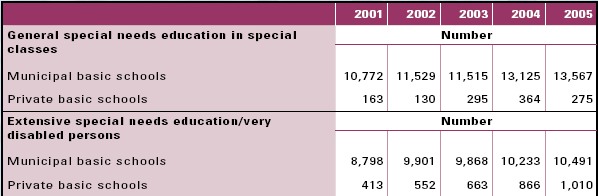
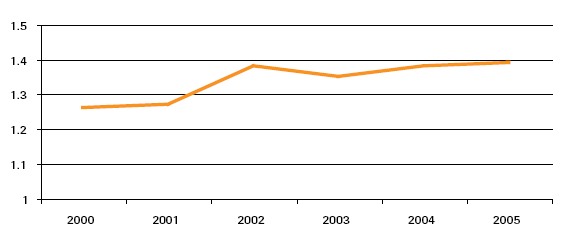
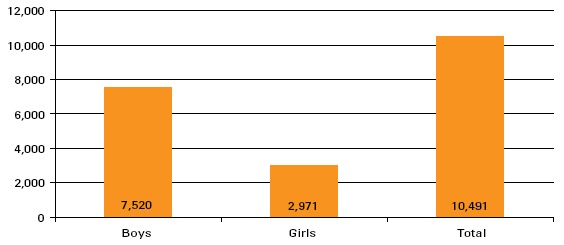
4.3 Pupils receiving special needs educationThe number of pupils receiving general or extensive special needs education has increased markedly from 2001 to 2005. In the municipal basic schools, the number of pupils receiving general special needs education has increased by 26 %, whereas the number receiving extensive special needs education has grown by 19 %. Special needs education is the education given in accordance with the Basic School Act to children and young people whose development poses a requirement for special consideration or support that cannot be given within the framework of the normal education. Before the municipal reforms coming into effect on 1st January 2007, there were two kinds of special needs education: general and extensive. General special needs education under municipal management comprised for example pupils who had difficulties in single subjects or had difficulties reading and writing, and it frequently took place in the pupils regular school, either as special support in the classroom or in special classes. Extensive special needs education under county management comprised specific and expensive measures, and frequently it took place as extra support in the regular classroom, in a special county school, or in a special care institution or in a daytime therapeutic institution. This involved for example pupils with a hearing impairment, autism, or psychical development restraints. Beginning 1st January 2007, there is no longer a distinction between extensive and general special needs education since both kinds of special needs education are now a municipal responsibility, whereas it formerly was divided between counties and municipalities. Special needs education also takes place in the private basic schools; here, the group of pupils requiring additional expenditure is designated severely disabled pupils. In 2005, 13,600 pupils in municipal basic schools received general special needs education in special classes compared to 10,800 in 2001 (table 4.4). This corresponds to an increase of 26 %. In the same period, the number of pupils in municipal basic schools (including pupils in special schools) increased by 4 %. Likewise, the number of municipal basic school pupils in extensive special needs education has increased. In 2005, 10,500 pupils received extensive special needs education compared to 8,800 pupils in 2001. This corresponds to an increase of 19 %. For the severely disabled pupils, the private basic schools may apply to the Board of the State Education Grant and Loan Scheme (the SU Board) for a subsidy for special pedagogical support (SPS). A direct comparison of private basic schools and municipal basic schools in this respect is not possible because the statistical bases differ. For instance, it should be noted that the private basic schools, unlike the municipal basic schools, are not under obligation to admit all the children who apply to the schools. Like in the municipal basic schools, the number of pupils in general special needs education classes in the private basic schools has increased. Thus, from 2001 through 2005, the number increased by 58 %. In absolute numbers, however, the increase is only from 163 to 275 pupils. In comparison, the number of pupils in the private basic schools increased by 13 % from 80,100 to 90,800 in the same period. The number of severely disabled pupils in the private basic schools grew from 413 in 2001 to 1,010 in 2005, an increase of 145 %. This is a consequence, among other things, of the circumstance that there are now more pupils in the private basic schools, and therefore, the variation of the pupil population is assumed to approach that of the municipal basic schools. Figure 4.5 illustrates the number of pupils in extensive special needs education in the municipal basic schools as a proportion of the total number of children between six and sixteen years of age. General learning disability is the most frequent reason of referral of pupils to extensive special needs education and amounted to 43 % of the pupils in 2005. This category covers widely and includes persons who are mentally retarded, late developers, etc. In 2005, 23 % of the pupils were referred because of behavioural and mental difficulties (figure 4.6). In the extensive special needs education in municipal basic schools, the boys are distinctly overrepresented, and in 2005, they made up 72 %, corresponding to 7,500 pupils of a total of 10,500 (figure 4.7). Table 4.4. General and extensive special needs education in municipal and private basic schools
Figure 4.5. Percentage of pupils in extensive special needs education in municipal basic schools in percent of the total number of children in the age group 6-16 years.
Figure 4.6. Reasons for referral to extensive special needs education in municipal basic schools, 2005, percent
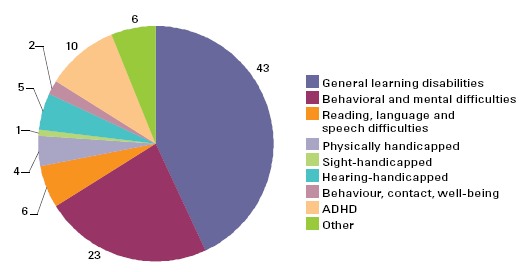
Figure 4.7. Pupils in extensive special needs education in municipal basic schools by gender, 2005
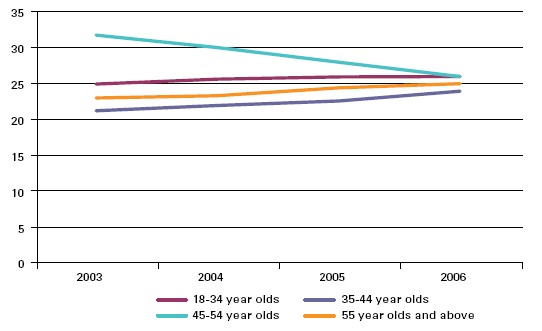
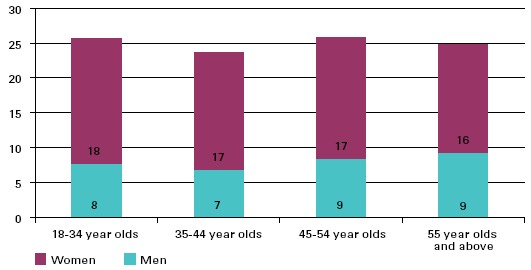
4.4 Number of teachersIn 2006, there were 62,600 teachers in the basic schools. Two thirds of the teachers are women. In the year 2006, there were 62,600 teachers in the basic schools. 51,400 of these were employed by municipal basic schools, 7,500 by a private basic school, and 3,700 were employed by a continuation school (table 4.5). From the year 2003 through 2004, the number of teachers in municipal basic schools decreased by 700. Subsequently, the number of teachers increased by good 600 up to 2006. From 2003 through 2006, there was an increase of good 500 teachers in the private basic schools. In the continuation schools, the number of teachers increased by 200 from 2004 through 2006. When considering the age distribution of the teachers in basic school (excluding continuation schools), it is seen that in particular the group of 45 to 54 year olds has diminished in recent years, although the group is the largest throughout all of the period. Thus, in 2003, the group of 45 to 54 year olds made up 32 % as compared to 26 % in 2006. During the same period, the group of teachers over 55 years old has increased by two percentage points, whereas teachers in the age group 35 to 44 years old has increased by nearly three percentage points. The proportion of teachers 34 years of age or less has increased by a good percentage point (figure 4.8). In general, the teachers in the private basic schools with 42.8 years of age in average are slightly younger that those in the municipal basic schools who are 47.7 years old in average. The gender distribution among teachers and school managers is skewed. Two out of three teachers are women. On the other hand, two out of three school managers are men (does not emerge from the table). The gender skew is strongest among teachers in the youngest age group (figure 4.9). Table 4.5. Number of teachers in basic school
Figure 4.8. Age distribution of teachers, percent
Figure 4.9. Age distribution of teachers by gender, 2006, percent
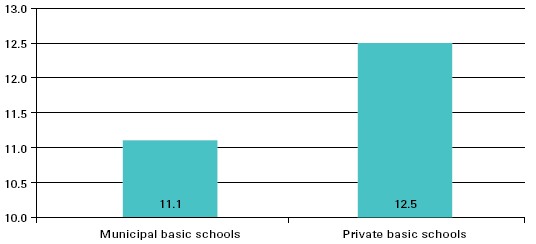
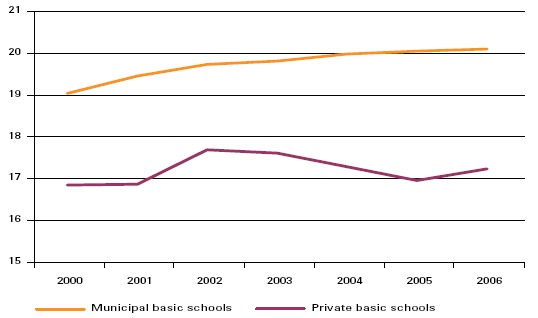
4.5 Pupil/teacher ratio and normal class sizeCompared with the municipal basic schools, there are slightly more pupils per teacher in the private basic schools. The normal class size has been increasing in the municipal as well as in the private basic schools. The pupil/teacher ratio describes the ratio between the number of pupils and the number of teachers, that is to say the average of number of pupils per teacher. In 2006, the pupil/teacher ratio was 11.1 in the municipal basic schools, whereas it was 12.5 in the private basic schools. Thus, there are slightly more pupils per teacher in the private basic schools (figure 4.10). These numbers have not changed notably in recent years. The normal class size expresses the average number of pupils in a class. Dedicated special classes are not counted in the normal class size calculation. In recent years, the normal class size in municipal basic schools has increased. In 2000, the average number of children in a class was 19.0, while in 2006 it was 20.1. During the period, the class-size average has thus increased by one pupil (figure 4.11). The private basic schools have also had a small increase in the normal class size, from 16.8 children in a class in 2000 to 17.2 in 2006. The variation in normal class size is greater in the private basic schools than in the municipal basic schools; here, there has been a slight increase during the entire period. The increase in normal class size is primarily a result of fewer municipal basic schools, while simultaneously, there has been an increase in the number of pupils. Figure 4.10. Pupil/ teacher ratio, 2006
Figure 4.11. Normal class size in municipal and private basic schools 2000-2006
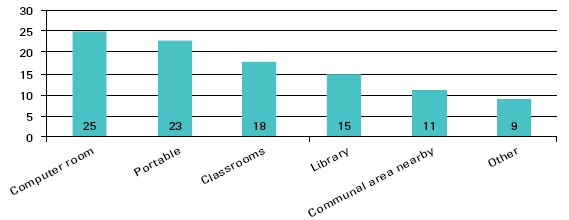
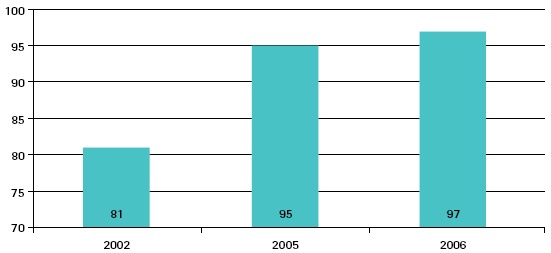
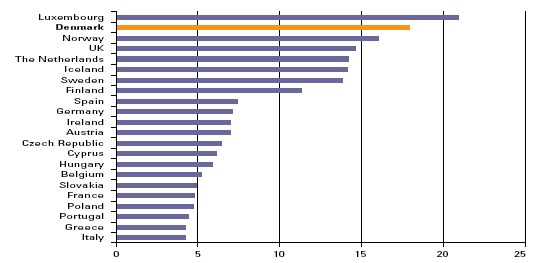
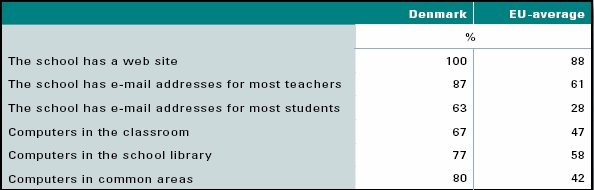
4.6 Key figures for use of computers in Denmark and selected countriesIn 2006, there were nearly five pupils for each newer teaching computer in municipal basic schools. 97 % of the computers were connected to the Internet. Denmark has chosen to concentrate on computers as a means to support and stimulate the pupils in the education. Thus, in 2003, the government adopted a plan of action with the aim to strengthen the computer skills of the basic school pupils. As a result of this plan of action, the number of pupils per newer computer2 dropped markedly, and in 2006, there were less than five pupils per newer teaching computer in municipal basic schools as compared to nearly 10 pupils in 2002. Figure 4.12 shows how the computers were distributed in the municipal basic schools in 2006. 25 % of the computers were placed in a computer room, while 18 % were placed in a classroom and 11 % in a communal area nearby. 23 % of the computers were portable. In 2006, 97 % of the computers in municipal basic schools had Internet access. In 2002, this proportion was 81 % (figure 4.13). A survey of the use of computers in the basic school in the EU countries3, initiated by the European Commission, shows that Denmark had 18 computers with access to the Internet per 100 pupils in 1st through 6th form in 2006. This is the second highest number in EU. The highest number is found in Luxembourg, which had 21 computers with access to the Internet per 100 pupils. Norway and UK follow just after Denmark with 16, respectively 15 computers with access to the Internet per 100 pupils (figure 4.14). There is a relatively clear clustering of EU countries with at least 14 computers with access to the Internet and of those with less than 10. Luxembourg, Denmark, Norway, UK, the Netherlands, Iceland, and Sweden had at least 14 computers with Internet access per 100 pupils in 1st through 6th form. Finland had 11 computers with Internet access per 100 pupils, whereas the rest of the countries had less than 10 computers with access to the Internet per 100 pupils in 1st through 6th form. Figure 4.12. Distribution of teaching computers in municipal basis schools in percent, 2006
Figure 4.13. Proportion of teaching computers with Internet access in municipal basic schools
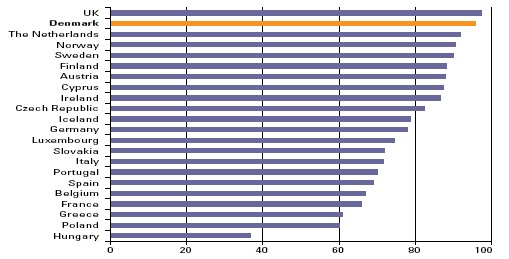
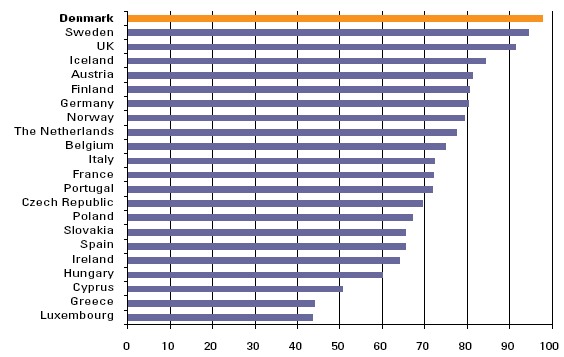
As seen from figure 4.15, 96 % of the teachers in Danish basic schools had used computers in their teaching. Only UK had a higher proportion (97 %). With the exception of Hungary where 37 % of the teachers had used computers in their teaching, at least 60 % of the teachers in 21 of 22 selected EU countries had used computers in their teaching. Figure 4.14. Number of teaching computers with Internet access per 100 pupils in 1st through 6th form of basic school, in Denmark and selected EU countries, 2006
Figure 4.15. Percentage of teachers in 1st through 6th form who have used computers in teaching in the last 12 months in Denmark and selected EU countries, 2006
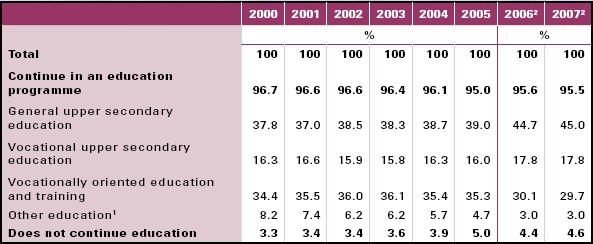
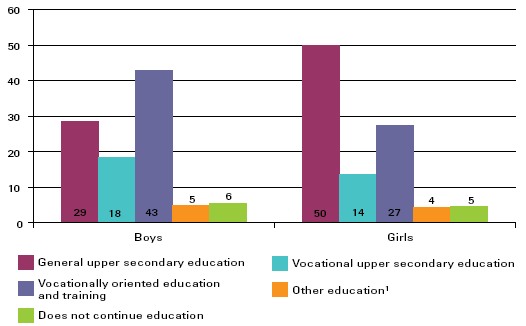
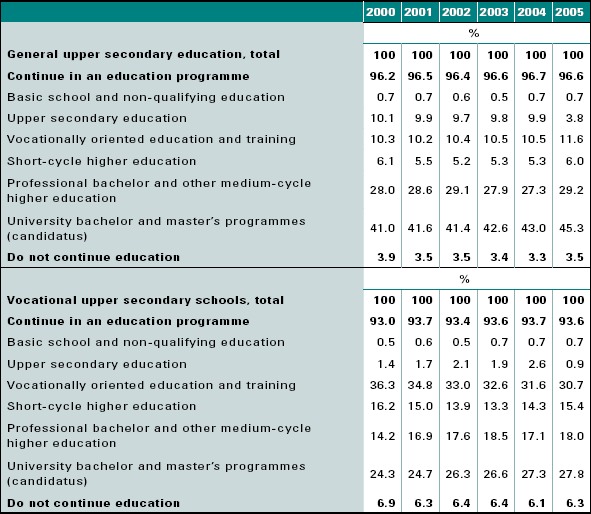
4.7 What do pupils do after basic school95 % continue in an education after having completed basic school. The girls primarily choose the general upper secondary education, whereas the boys prefer a vocationally oriented education and training programme. Nearly all pupils continue in a youth education after basic school. In the spring 2007, almost 96 % of the pupils in 9th and 10th form had enrolled to start an education directly after the summer holidays (table 4.6). At the youth education enrolment of the 9th and 10th form pupils in 2007, 45 % enrolled in a general upper secondary education programme, while nearly 18 % enrolled in a vocational upper secondary education programme. Almost 30 % of the graduating pupils enrolled in a vocationally oriented education and training programme. It is, however, questionable which education the young people will choose in reality. In recent years, a steadily increasing proportion of the pupils, who continue in an education, start in an upper secondary education programme. In 2005, 39 % started a general upper secondary education, whereas 16 % enrolled in a vocational upper secondary education programme. In the same year, 35 % started a vocationally oriented education and training programme. There is a distinct difference in boys and girls choice of education. While half of the girls chose a general upper secondary education programme, this was the case for only 29 % of the boys. On the other hand, a larger proportion of the boys (18 %) than of the girls (14 %) chose a vocational upper secondary education. A vocationally oriented education and training was also chosen primarily by the boys. Thus, 43 % of the boys but only 27 % of the girls chose a vocationally oriented education and training (figure 4.16). Table 4.6. Behaviour after basic school
Figure 4.16. Behaviour after basic school by gender, 2005, percent
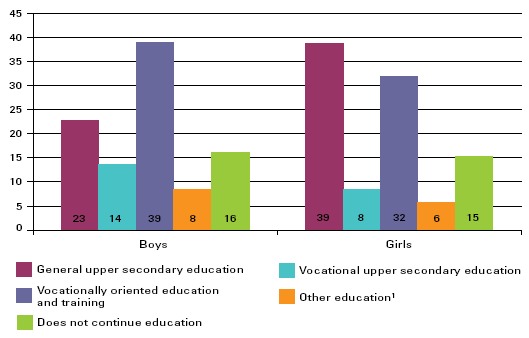
Figure 4.17 shows the distribution of immigrants and descendants by gender who continue in education after the 9th and 10th form. The trend is the same for this group: the girls chose primarily a general upper secondary education, whereas the boys chose a vocational upper secondary education, in particular the higher technical examination (htx), and vocationally oriented education and training programmes. However, a far greater percentage of immigrants and descendants do not continue in an education programme. Whereas 6 % of the boys in total do not continue in an education programme, this is the case for a good 16 % of the boys among immigrants and descendants. As for the girls, a little less than 5 % of the total group do not continue in an education programme, whereas it is the case for a good 15 % of the girls in the group of immigrants and descendants. Figure 4.17. Behaviour of immigrants and descendants after basic school by gender, 2005, percent
Footnotes
2) Newer computers are defined as computers less
than five years old or used as terminals of a centralized
server.
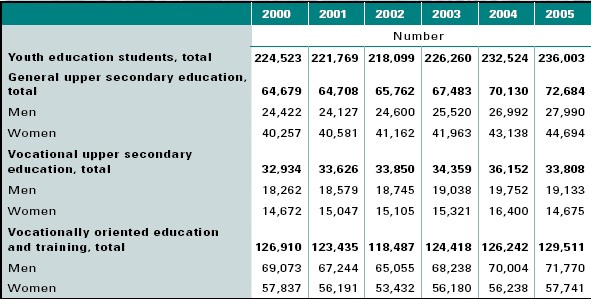
5 Youth education5.1 Number of schools and studentsToday, 81 % of a youth cohort receive a youth education. It is the governments goal that 95 % of a youth cohort receive a youth education in 2015. The youth education programmes comprise the higher education preparatory general upper secondary studies and the vocational education and training programmes that target the labour market, but which may also give admission to higher education. In total, in 2006, there were 148 general upper secondary educational institutions in the country. 117 schools offered vocationally oriented education and training programmes and vocational upper secondary education programmes. The vocational schools have many local branches so that youth education is available all over the country (table 5.1). From table 5.2 it may be seen how many students have been enrolled in a youth education in the years 2000 through 2005, and how they are distributed by gender. In 2005, 236,000 students were enrolled in a youth education. Of these, 106,500, equivalent to 45 %, were enrolled in an upper secondary education programme, and 129,500, equivalent to 55 %, were enrolled in a vocationally oriented education and training programme. Table 5.1. Number of educational institutions with youth education programmes
Table 5.2. Number of students in youth education by gender
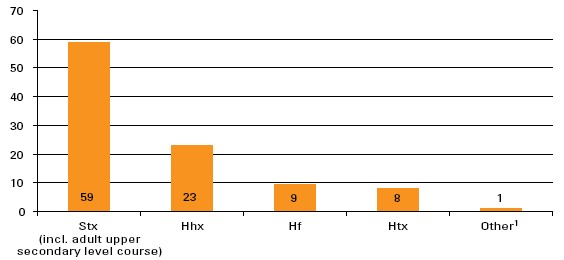
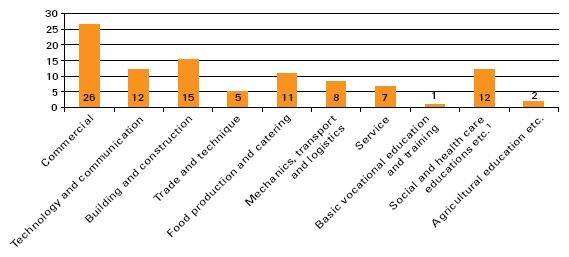
In 2005, there were 72,700 students in the general upper secondary education programmes comprised of the upper secondary school leaving examination (stx) and the higher preparatory exams (hf ). The majority by far (86 %) of these chose stx, while 14 % preferred hf. The vocational upper secondary education programmes, consisting of the higher commercial examination (hhx) and the higher technical examination (htx), accounted for 33,800 students in 2005. The greater part (72 %) took hhx, while a good fourth studied for htx. The drop in number of students from 2004 to 2005 was caused by the closing down of the one-year hhx. In the general upper secondary education programmes, there are markedly more women than men, whereas there is a predominance of men in the vocational upper secondary education programmes and especially in the vocationally oriented education and training programmes. Figure 5.1 shows the distribution of students in the upper secondary education programmes in 2005. In 2005, most of the general upper secondary students were enrolled in stx (59 %). Hhx followed with 23 % of the students. Htx had a share of 8 % of the students, while the two-year hf had 9 %. In 2005, 129,500 students studied in a vocationally oriented education and training programme. Among the vocationally oriented education and training programmes, the following in particular are popular: the commercial education programmes, building and construction programmes, social and health care training programmes, and technology and communication programmes (figure 5.2). Figure 5.1. Distribution of students in upper secondary youth education per education programme, 2005, percent
Figure 5.2. Distribution of students in vocationally oriented education and training by education programme, 2005, percent
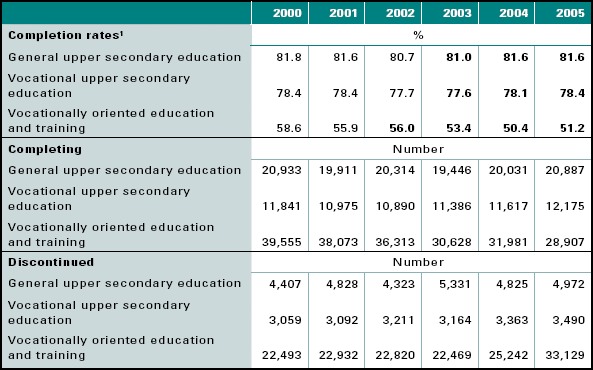
When starting the stx programme, the students are 16.5 years old in average, while in hhx and htx they are approximately 17 years old. When graduating stx, the students are 19.5 years old in average and around 20 years old when graduating hhx or htx. In the stx, hhx, and htx programmes, the students have the same age, whereas there is a wider variation in the age of the students in the two-year hf programme, which also caters to adults. In average, the students in the hf programme are 19 years old when they start, while their average age is 20.5 when they complete (does not emerge from the figure). The average age when completing is only 1.5 years higher than when starting the two-year education programme because the younger age groups are better at completing than the older ones. In the vocational education and training programmes, the students are almost 21 years of age when they start the basic course of study, and when they start the main course, they are nearly 26 years old since some of them do not come directly from a basic course. When they complete their education, they are 28 years old in average. Most of them are under 25 years old when they complete their vocational education and training programme but the variation in age is very wide in the vocational education and training programmes. For example, students within the social and health care system are almost 34 years old in average when they graduate. These education programmes as well as other vocationally oriented education and training programmes are widely used to upgrade the qualifications of the labour force, for example via adult apprentice schemes. 5.2 Completion, dropout, and behaviour after dropoutIn the upper secondary education, the greater part of the students completes the programme, whereas only a good half of the students in vocationally oriented education and training complete a programme The completion rate is a measure of the proportion of students who have started an education programme the year in question, and who finish that programme. Eight of ten students are expected to complete their education in the upper secondary programmes. There is, however, a large variation. With 84 %, stx has the highest completion rate. Then hhx follows with 80 %, htx with 71 %, and hf with 66 %. In 2005, 33,100 students graduated (table 5.3). The vocationally oriented education and training programmes typically start with a basic course of study of 20 to 60 weeks duration. Approximately 70 % of the students complete the basic course of study that they started. Unless they already have one, the students then need a practice placement so they can continue with the main course of study and complete the education. Otherwise, in some of the programmes, the students may continue in school practice. The main course of study takes approximately three years and 80 % complete their main course (ref. section 5.5). Only a good half (51 %) of those who start a vocationally oriented education and training programme are expected to complete it. This is owed to circumstances such as not all students obtaining a practice placement, some students changing to another education en route, and still others dropping out. During the period from 2000 to 2005, the number of students completing a vocational education and training programme dropped from nearly 39,600 to 28,900. This was caused by a decreasing number of students in the year groups, a higher dropout rate, and more students choosing an upper secondary programme. As mentioned in the previous section, the compositions of the student groups in upper secondary education and vocationally oriented education and training programmes are different, which should be taken into consideration when comparing the completion rates. Table 5.3. Completion rates, number of students who complete an education, and number of students who drop out on the way
Figure 5.3. Completion rates in youth education programmes
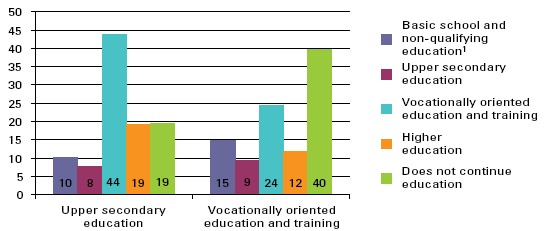
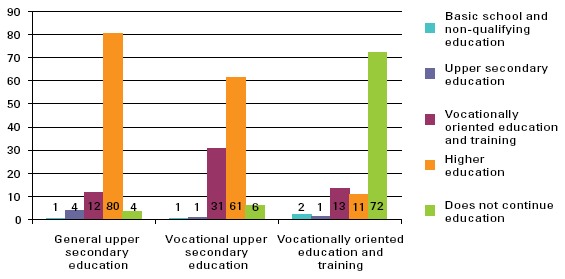
The major part of the students dropping out of an upper secondary education are expected to start a new education. The major part (82 %) of those dropping out of the general upper secondary education are expected to start another youth education. The same is expected as regards 85 % of those dropping out of a vocational upper secondary education. Of those dropping out of a vocationally oriented education and training programme, only 60 % are expected to start another education (figure 5.4). Since 2001, the tendency to continue the education has been decreasing slightly in general upper secondary education. In vocational upper secondary education and in vocationally oriented education and training, the trend has likewise been falling since the year 2003. 44 % of those dropping out of an upper secondary education are expected to start a vocationally oriented education and training programme within ten years, whereas 19 % are expected to start a higher education4. 8 % are expected to start a new upper secondary course of education (figure 5.5). 24 % of the students who drop out of a vocationally oriented education and training programme are expected to start a new vocationally oriented education and training programme while 12 % are expected to start a higher education. A proportion of 9 % is expected to start an upper secondary education programme. 40 % do not continue in education within ten years. Figure 5.4. Behaviour after discontinued youth education proportion expected to start another education within ten years
Figure 5.5. Behaviour after discontinued youth education proportion expected to start another education within ten years, 2005
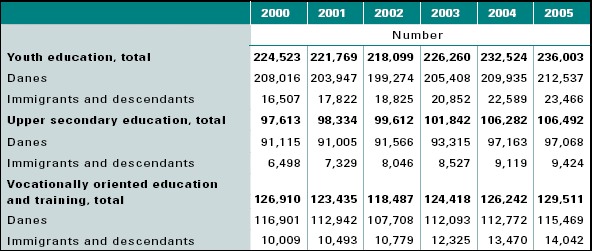
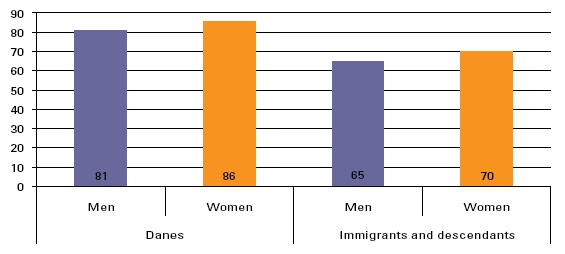
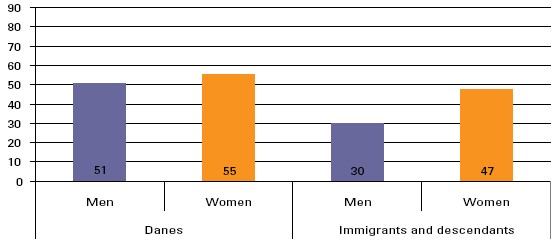
5.3 Immigrants and descendantsFrom 2000 to 2005, the proportion of immigrants and descendants in youth education has increased steadily. In 2005, the proportion of immigrants and descendants completing an education was generally lower than the proportion of ethnic Danes. Irrespective of ethnicity, the women are better at completing than the men are. In 2005, one in ten students in youth education had an ethnic background other than Danish. In total, there were 23,500 immigrants and descendants with 9,500 in an upper secondary education where they made up 9 % of the students, and 14,000 in a vocationally oriented education and training programme where they made up 11 % of the students (table 5.4). In the upper secondary education programmes as well as in the vocationally oriented education and training programmes, the number of immigrants and descendants has increased. In 2000, the number of immigrants and descendants in upper secondary education was 6,500, corresponding to 7 %, and 10,000 in the vocationally oriented education and training programmes, corresponding to 8 %. There is a more even gender distribution in youth education among immigrants and descendants than there is among ethnic Danes. In upper secondary education, the women made up 54 % in 2005, while there were largely the same number of men and women in the vocational education and training programmes. In upper secondary education, the women chiefly chose the general programme, whereas the men largely choose a vocational programme. In the vocationally oriented education and training programmes, the men choose a technical education, whereas the women especially choose a social and health care education (does not emerge from the table). The completion rate is a measure of the proportion of students who have started an education programme the year in question, and who finish that programme. The completion rate is a measure of the proportion of students who have started an education programme the year in question, and who finish that programme. Only 39 %, of the immigrants and descendants who start a vocationally oriented education and training programme are expected to complete it. When comparing the completion rates for ethnic Danes with the completion rates for immigrants and descendants in the upper secondary education programmes, the ethnic Danes in general, have a higher completion rate. In the upper secondary education programmes, nearly 86 % of the Danish women are expected to complete in contrast to 70 % of the women among immigrants and descendants. For the men, the corresponding figures are 81 % for Danish men and 65 % for men among immigrants and descendants (figure 5.6). The same pattern is observed in the vocationally oriented education and training programmes as in upper secondary education. In general, the ethnic Danes have a higher completion rate than immigrants and descendants, while the women likewise have a generally higher completion rate than the men. Among the women, 47 % are expected to complete a vocationally oriented education and training programme in contrast to only 30 % of the men (figure 5.7). Besides, women in general being better at completing, the very large difference may also be a consequence of the women primarily choosing the significantly shorter social and health care education programmes. Table 5.4. Number of students in youth education by ethnic background
Table 5.5. Completion rates, immigrants and descendants
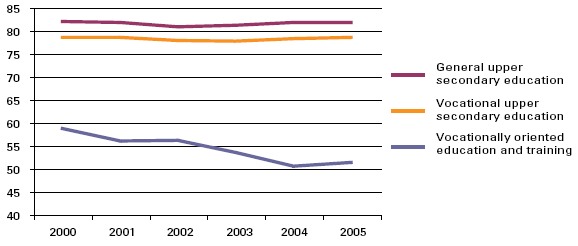
Figure 5.6. Completion rates in upper secondary education by ethnicity and gender, 2005
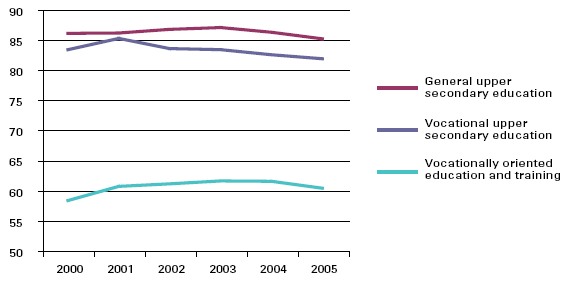
Figure 5.7. Completion rates in vocationally oriented education and training by ethnicity and gender, 2005
5.4 Choice of subjects in upper secondary schoolsThe upper secondary education programme has undergone a reform that has strengthened the natural science subjects. Consequently, after the reform, more students will be qualified to apply to an education within natural sciences, technology, and health. Conversely, a smaller proportion of the future higher education students will master three or more foreign languages as compared to the situation before the reform. Upper secondary education has undergone a major reform that has influenced the structure and contents of the education programmes. The three upper secondary education programmes: Upper secondary school leaving examination (stx), higher commercial examination (hhx), and higher technical examination (htx) have been given a common structure with an introductory foundation course of study with a duration of half a year and a subsequent major line of study with a duration of two and a half years. Each education programme has major subjects, mandatory subjects and electives. In upper secondary schools, the subjects may be taken at A, B, or C level respectively, A being the highest level. The first year group to start in the new reform began their education in 2005, and they will complete it in 2008. As purposed, the reform has strengthened the natural sciences with the future graduates. Furthermore, the future graduates will have fewer foreign languages, but the ones they do have will be completed at a higher level. In stx, the proportion of students with three foreign languages was 41 % before the reform. After the reform, this proportion is expected to be less than 7 % (figure 5.8). The proportion of students in hhx who had at least three foreign languages before the reform was 18 %. After the reform, this proportion is expected to drop to 6 %. Thus, there will be a drop of 12 percentage points from 2006 to 2008. Since htx is a technical upper secondary education, no students in this programme take three foreign languages neither before nor after the reform. An important goal of the reform is to increase the proportion of graduates who meet the requirements for admission to an education programme within natural sciences, technology, and health. This requires that the students have taken mathematics at level A, and physics and chemistry at least at level B. Only graduates from stx and htx will have the opportunity to meet these requirements. In 2006, the proportion of graduates with mathematics A and physics and chemistry at least at level B was 14 % for stx, while the corresponding proportion after the reform in 2008 is expected to be 22 %, and thus 8 percentage points higher than in 2006 (figure 5.9). In the htx programme in 2006, nearly half of the graduates had taken mathematics at level A and physics and chemistry at least at level B. After the reform, barely 74 % are expected to take these subjects and levels. Thus, here we have an increase just short of 28 percentage points. Figure 5.8. Proportion of students in 2006 and anticipated proportion of students in 2008 with at least three foreign languages in stx and hhx
Figure 5.9. Percentage of students in 2006 and anticipated number of students in 2008 who take mathematics A and physics and chemistry at minimum level B in stx and htx
5.5 Vocational education and training practice placementsThe number of contracted practice placements has increased markedly from 2003 to 2006. During the same period, the number of practice placement applicants and students in school practice has fallen considerably. The vocational education and training programmes (EUD) are alternating programmes where parts of the training takes place in a school, while other parts take place in practice. Therefore, the students should apply for a practice placement and enter a contract about a practice placement with an enterprise. Students who cannot find a practice placement themselves may take their practice in school. During recent years, the number of contracted practice placements has increased markedly. During 2006, nearly 36,100 contracts were entered an increase of 38 % compared to 2003 where slightly less than 26,200 contracts were entered (table 5.6). Contracts entered refer to the number of students who have contracted a practice placement during the year. Ongoing contracts refer to the number of students who are placed in practice with a contract. Students in school practice refer to the number of students who are in school practice at the end of December. Total number of practice placement applicants includes students without an ongoing or planned contract who have qualified for the desired main course of study, and who have confirmed their application. Students in school practice do not have a contract, and therefore they count as placement applicants. By end December 2006, 4,800 students were applying for a practice placement, a drop of 58 % compared to 2003 where there were 11,400 applicants. In part, the drop may be attributed to a change in requirements to the students status as applicants. Improved opportunities for obtaining a practice placement, however, have also contributed to the decrease. In 2006, there were 62,700 students with a contract. From 2003 to 2004, the number dropped from 55,000 to 54,200; however, since 2004 there has been a steady increase in the number. There has been a significant drop in the number of students in school practice. Thus, from 2003 to 2006, the number decreased by 66 %, and in 2006, there were slightly less than 2,600 students in school practice. The significant decrease in number of students in school practice is owed to improved opportunities to obtain a practice placement as well as the introduction of restricted admission to school practice in eight of the education programmes. These eight programmes are: information technology and communication, office with special subject, technical designer, mechanic, electronics and low power, electrician, carpentry, and cabinet making. The restriction of admission to school practice for these education programmes is specific to the programme. Formerly, in the case of some education programmes, the enterprises, rather than undertaking a training contract, let the students take school practice. In other cases, a low employment rate for skilled persons in school practice was a decisive factor. Figure 5.10 shows the development in number of practice placement applicants for the period 2003 through 2006. Figure 5.11 shows ongoing contracts and students in school practice by ethnicity. In 2006, a significantly larger number of Danes as well as immigrants and descendants had an ongoing contract as compared to 2003. Especially the immigrants and the descendants have benefited from the higher number of contracts. The proportion of Danes with a contract has increased by 13 %, whereas the proportion of immigrants and descendants has increased by 33 %. In 2006, fewer students were undertaking school practice compared to 2003. For the group of Danes, the number of students in school practice has decreased by 69 %, while the decrease is 52 % for the group of immigrants and descendants. Since the drop has been less for immigrants and descendants than for Danes, the former constituted a larger proportion of students in school practice in 2006 than in 2003. In 2006, immigrants and descendants made up 25 % of all students in school practice as opposed to 17 % in 2003. Table 5.6. Practice placement applicants and contracts at the end of December
Figure 5.10. Practice placement applicants and contracts at the end of December
Figure 5.11. Ongoing contracts and students in school practice at the end of December by ethnicity, 2003 and 2006
5.6 International mobilityIn 2005, 1.4 % of all students in vocational education and training programmes have had practice abroad. Supported by either the Danish practice scheme, Practice Abroad (PIU), EUs Life Long Learning Programmes (Leonardo da Vinci, Comenius), the DK-USA programme, or the Nordic Nordplus programme, students in the vocationally oriented education and training programmes may complete a part of their education at schools or in practice abroad. Typically, the exchange programmes last from one to nine months and give credits. That is to say that the time abroad is credited in the Danish vocational education and training programme. The number of Danish students in the vocationally oriented education and training programmes who complete a practice placement abroad increased from 1,369 in 2000 to 1,866 in 2005. The increase came primarily from students in practice abroad under the Danish PIU scheme and from EUD students in practice and study visits abroad through the EU programme Leonardo da Vinci. Young Danish people are especially attracted to Norway, Great Britain, Germany, and Sweden. These four countries account for a total share of 72 %. Table 5.7. Students in vocationally oriented education and training programmes who complete a practice placement abroad
5.7 Key figures for use of computers in Denmark and selected countriesAs it is the case for the basic school, Denmark tops in the use of computers in upper secondary youth education. There are many computers in youth education, and they are used for teaching. In 2006, there were 37 computers with Internet access per 100 students in upper secondary education. Only Norway exceeded this number with 40 computers with Internet access per 100 students. Immediately hereafter, countries that Denmark normally compares with follow, namely Sweden and UK with 28, respectively 25 computers with Internet access per 100 students. In 2006, all youth educational institutions in Denmark had a web site, while the average in EU was 88 %. Additionally, 87 % of the schools in Denmark had e-mail addresses for most of the teachers, while 63 % of the schools had e-mail addresses for most of the students. This is 26, respectively 35 percentage points more than the average for youth educational institutions in EU (table 5.8). This places Denmark considerably over the EU average for some of the tools that among other things must be available in order to develop qualifications and knowledge within information technology. 67 % of the youth education schools in Denmark had computers in the classroom compared to an EU average of 47 %. It should be added that many Danish young people themselves bring a computer to school. In the Danish school libraries, there was at least one computer in 77 % of the youth educational institutions, which is 19 percentage points over the EU average. There is an even greater difference between the Danish and European/ EU standards as far as computers in the communal areas are concerned. In 2006, there were computers here in 80 % of the youth educational institutions in Denmark, whereas this was only the case for 42 % of the schools in EU. In the Danish youth education programmes, 98 % of the teachers had used computers in teaching last year. This places Denmark in the top among the countries in Europe. Then Sweden and UK follow where over 90 % of the teachers had used computers in classroom teaching within the last twelve months (figure 5.13). Figure 5.12. Number of teaching computers with Internet access per 100 students in upper secondary education, in Denmark and selected EU countries, 2006
Table 5.8. Key figures for information technology in upper secondary education, 2006
Figure 5.13. Proportion of teachers in upper secondary education who have used computers in teaching in the last 12 months in Denmark and selected EU countries, 2006
5.8 What do young people do after having completed a youth education programmePractically all students that complete their upper secondary education continue their education. This is also the case for a good fourth of the fully trained young people with a vocationally oriented education and training. An upper secondary education prepares for a higher education, whereas a vocationally oriented education and training is vocationally oriented. Thus, it is to be expected that the majority of the students who complete a higher secondary education continue their education. More precisely, 97 % of those who complete a general upper secondary education and 94 % of those who complete a vocational upper secondary education continue their education, whereas this is only the case for 28 % of those who complete a vocationally oriented education and training programme (table 5.9 and 5.10). Although upper secondary education primarily prepares for a higher academic education, 31 % of vocational upper secondary students are expected to continue in a vocationally oriented education and training programme. This is also the case for 12 % of the graduates from the general upper secondary schools (table 5.9). Eight out of ten who graduate from a general upper secondary school and a good six out of ten who complete a vocational upper secondary programme are expected to pursue a higher education. Especially the university bachelor education is popular among the general upper secondary graduates. In 2005, 45 % of the graduates from the general upper secondary schools started in university, whereas 29 % started a professional bachelor education, and 6 % started a shortcycle higher education. 28 % of the students in a vocational upper secondary programme are expected to continue in a university programme, 18 % in a professional bachelor programme, and 15 % in a short-cycle higher education programme. In 2000, one in ten graduates from a general upper secondary school continued in another upper secondary education programme. This proportion dropped to 4 % by 2005 where the one-year hhx, which could be taken on top of another upper secondary, was closed down. Thus, this option no longer exists. Table 5.9. Behaviour after completing upper secondary education proportion expected to begin further education within ten years
The majority by far (72 %) of those who complete a vocationally oriented education and training programme naturally leave the education system and become available to the labour market. Nearly 28 % will resume their education within the next ten years. In total, 13 % are expected to start another vocationally oriented education and training programme; while a good one in ten is expected to start a higher education. Table 5.10 shows that over time, there is only a modest fluctuation in the percentages Figure 5.14 shows which education students who graduate from the upper secondary schools and the vocational schools are expected to start within 10 years. Table 5.11 shows how many are in the course of another education programme 15 months after having graduated from an upper secondary school. More than half of the graduates are under way again after 15 months, corresponding to one year plus a summer holiday. The young people get started quickly. As shown, nearly 59 % were on the go after one year in 2005. This proportion has been increasing in recent years. In 2000, a good 54 % were on the way 15 months after graduating from a general upper secondary education. Especially in the higher education programmes, the young people get started faster. In 2005, nearly 43 % had started a higher education after 15 months as compared to close to 36 % in 2000. The vocational upper secondary graduates get started the fastest. A good 67 % start within 15 months compared to 53 % of the graduates from general upper secondary schools. Table 5.10. Behaviour after completing a vocational education and training programme proportion expected to begin further education within ten years
Figure 5.14. Behaviour after completed youth education proportion expected to start another education within ten years, 2005
Table 5.11. Percentage of students who 15 months after having graduated general upper secondary school have started further education
Footnotes4) They may be admitted on exemption or after having complemented with single subject hf classes.
6 Higher education6.1 Number of institutions and studentsIt is the governments goal that 50 % of a year group receive a higher education in 2015. Today, almost 44 % of a youth cohort is expected to receive a higher education. In 2006, there were 152 institutions offering higher education. They vary greatly in size from big universities with thousands of students to small institutions with but a few (table 6.1). Today, there are many ongoing changes and reorganizations of the structure of institutions. In 2007 several universities have been merged and amalgamated with sector research institutions, so from 2007 there are eight universities in Denmark. Furthermore, the major part of medium-cycle higher education is consolidated in seven professional higher schools, while the short-cycle higher education programmes are combined in ten vocational academies. In 2005, 198,900 students studied in a higher education programme. Of these, more than 55 % (that corresponds to 110,300) studied in a university programme, 34 % (that corresponds to 68,500) in a professional bachelor programme and 9 % (that corresponds to 18,500) in a short-cycle programme (table 6.2). During the period 2000-2005, there has been a population increase of 9 % in the university education programmes. The professional bachelor education programmes have experienced an increase of 5 %, whereas short-cycle education got almost 5 % fewer students in that period. The increase in medium-cycle higher education, in particular, is owed to the number of students in university bachelor programmes having gone up by 18 %. That corresponds to 8,700 students. The increase in number of students in university bachelor programmes is especially due to the structural change that has taken place in the university field since 1993, and that has lead to long-cycle higher education being separated into a bachelor programme and a masters programme (candidatus). This means that the former unity masters programmes (candidatus) have been replaced with a university education programme divided in two parts where the students first must complete a university bachelor education before being admitted to a masters programme (candidatus). An increase is noted in medium-cycle higher education because the university bachelor programmes are placed in that group. To some extent, the increase in the bachelor programmes corresponds to the decrease in the masters programmes (candidatus). Table 6.1. Number of institutions offering higher education
Table 6.2. Number of students per higher education programme
6.2 Age at startIn 2005, the young people are a little quicker at getting started on an education than they were in 2000. Furthermore, young people in vocational upper secondary schools are quicker at getting started than young people in general upper secondary schools. The time passing until the young people start a higher education after upper secondary school varies depending on whether they come from a general upper secondary or a vocational upper secondary school and depending on which education they start. In general, the young people who have attended a vocational upper secondary school are a little quicker in starting a higher education than those who have attended a general upper secondary school. In consequence, the students are now younger when they start their studies. Since 2002, the median age at the start of a higher education has been decreasing. Table 6.3 illustrates the median age at the start of study. The median age is the middle value in the age distribution. It means that the number of students that are younger than the stated age is equal to the number of students that are older. The median age for students starting a short-cycle higher education in 2005 was 23.4 years. Thus, there is a slight decrease in the age of the students since 2002 where the median age of the students was 23.8 years. In 2005, for the students in the professional bachelor education programmes, the median age was 23.7 years at the start of study; this is a decrease compared to 2002 when the median age was 24 years. In university bachelor education, the students had a median age of 21.6 years at the start of study compared to 21.9 years in 2002. Although the greater part of the students in short- and medium-cycle higher education is in the beginning of the twenties at the start of study, a relatively large part of the students have a very high age when they start their study (figure 6.1) The high age at the start of study is partly owed to the fact that only 38 % in short-cycle higher education and 49 % in medium-cycle higher education come directly from a higher study preparatory school. The balance has another discontinued or completed education behind them. Thus, many of the fresh students have started before and subsequently changed their study. Table 6.3. Median age of students when starting their studies
Figure 6.1. Number of students by age at the start of study, 2005
6.3 Completion, dropout, and behaviour after dropoutApproximately 70 % complete a higher education. The majority of those who do not complete start a new education. The completion rate is a measure of the proportion of students who have started an education programme the year in question, and who finish that programme. In the short-cycle higher education programmes, the completion rate is 70 %. In the professional bachelor programmes, the rate is slightly higher, namely 75 %. In the university bachelor education, the completion rate is 68 %. In the masters programmes (candidatus), the completion rate is 73 % (table 6.4). In 2005, 5,400 completed a short-cycle higher education, 15,300 completed a professional bachelor education, and 10,500 completed a university bachelor education programme. Practically all who complete a university bachelor education continue directly in a masters programme (candidatus). In 2005, 11,500 students earned a masters degree (candidatus). Slightly more than half (54 %) of the students who discontinue a shortcycle higher education are expected to start another education. This is seven percentage points more than in 2002. Especially, they change to the vocationally oriented educational training programmes and medium-cycle higher education programmes (table 6.5). Almost six in ten students who discontinue their professional bachelor education start another education. In this group, especially the vocationally oriented educational training programmes and medium-cycle higher education are preferred. 68 % of the students who discontinue a university bachelor education programme are expected to start another education. Nearly half of this group is expected to start in a mediumcycle higher education programme. Only 19 % of those who have discontinued a masters programme (candidatus) are expected to start another education. The greater part of those who do will start in a mediumcycle higher education programme. Generally, this group has already completed a bachelor education, however. Figure 6.2 shows which education the students start after having discontinued a higher education. Table 6.4. Completion rates. Number of students who complete the education, and number of students who drop out on the way
Table 6.5. Behaviour after discontinued education proportion expected to start another education within ten years
Figure 6.2. Behaviour after discontinued education proportion expected to start another education within ten years, 2005
6.4 Length of study and age at graduationStudents in short-cycle higher education and professional bachelor students are better at completing their study in the designated time when compared with university bachelor students. In the short-cycle higher education programmes, the average length of study has been practically constant at two years during the period from 2000 to 2005. In 2005, it was 2.1 years (table 6.6). The quickest 25 % completed the education in a little less than two years, whereas the slowest 10 % take three years to complete. Practically everybody complete in the designated time, and the spread shows the variation in the designated times to complete a programme. Some programmes take almost two years, whereas the longest take four years (for example the police education). Likewise for the professional bachelors, the length of study has been relatively stable in the period shown. In 2005, the students took an average of 3.7 years to complete their study. In this group, the 25 % quickest students took 3.3 years, whereas the 10 % slowest took 4.8 years to complete their study. Likewise in this case, the length of study varies from 3.5 to 4.5 years. Thus, a small group of students take a longer time to complete their studies. The university bachelors took 3.4 years to complete in 2005. From 2000 through 2004, the average time of study was 3.5 years. The 25 % quickest graduated in 2.8 years5, whereas the 10 % slowest students took almost five years to complete. In average, the students thus have a delay in their education of nearly half a year. In the masters programmes (candidatus), the students took an average of 3.4 years to graduate, which corresponds to the level in the years 2000-2004. The 25 % quickest masters students (candidatus) took 2.3 years, whereas the 10 % slowest took 5.6 years to graduate. As the masters programmes (candidatus) have a designated duration of two years, this is where the longest delay is found. Traditionally, students in Denmark have been older of age when graduating, and their age has been increasing. However, it seems that this trend is turning except for the university bachelors where the age has been constant. In 2005, the age of the students who completed a short-cycle higher education was 25.8 years. As such, they were slightly younger than in 2000-2001 when the age was a little over 26 years (figure 6.3). After a slight decrease in 2005, the students who completed a professional bachelor programme were 27.3 years old, whereas the students in the university bachelor programmes with 25.2 years of age were a little more than two years younger. From 2000 through 2005, the students in the masters programmes (candidatus) have generally become slightly older at graduation. From a graduation age of 27.8 years in 2000, the age rose to 28.6 years in 2004. In 2005, the graduation age had fallen slightly to 28.5 years. Table 6.6. Average time to graduate in number of years
Figure 6.3. Median age at graduation
6.5 International mobilityIn higher education, there are more students coming to Denmark than there are Danish students going abroad. This is the case for students in exchange programmes as well as for students taking a full education abroad. The Danish students have the opportunity to complete an education abroad. This may take place through a study visit or a practice placement abroad as a part of a Danish education programme (exchange students) or through students taking a full education abroad. Likewise, foreign students have the option to come to Denmark for a study visit or a practice placement, or they may take a full Danish education. Normally, the exchange visits for students in higher education programmes last three to twelve months, and they give credits. That is to say, the subjects that are completed abroad give credits in the Danish education so that the stay abroad does not prolong the study. Several students in higher education go on an exchange programme supported by an international education programme such as Erasmus or Nordplus. In 2005, this was the case for approximately 45 % of all Danish exchange students. Others went with support from their own educational institution, from private foundations, or financed by themselves. More than 75 % of the foreign exchange students came to Denmark on an international exchange programme. In 2005, 4,744 Danish students completed a study visit or practice placement abroad as a part of a Danish higher education. During the same year, 6,479 foreign students completed an exchange programme in Denmark. The greater part of the exchange students studied in a long-cycle higher education programme (table 6.7). As shown in figure 6.4, the number of Danish exchange students increased from 4,326 in 2000 to 4,785 in 2003. Then the number dropped to 4,606 in 2004 and rose again to 4,744 in 2005. However, the increase seen from 2004 to 2005 is due to the short-cycle higher education programmes being counted from 2005 on. If the short-cycle higher education programmes were not counted, there would have been a status quo. Table 6.7. Number of students in an exchange programme, 2005
Figure 6.4. Number of Danish students in an exchange programme abroad and number of foreign students in an exchange programme in Denmark
The universities send out the most students. The five countries who received the most Danish exchange students were USA receiving 15 % of the total students abroad, Great Britain (10 %), Germany (9 %), Spain (8 %), and France (7 %). During the same period, the number of foreign exchange students in Denmark has shown an increasing trend. From 2000 to 2005, the number of foreign exchange students increased steadily from 3,849 to 6,479. The universities received nearly three fourth of all foreign exchange students. The most foreign exchange students came from Germany (12 %), France (11 %), Spain (11 %), Italy (8 %), and USA (15 %). Since 2002, more foreign exchange students came to Denmark than Danish exchange students went abroad. While some students choose to take a part of their education abroad, others choose to take the entire education abroad. In 2005, 3,523 Danish students were pursuing a full higher education abroad supported by the State Education Grant and Loan Scheme (SU). Since 2000, this number has dropped 17 %. The majority of the Danish students go to another European country, while 18 % go to countries outside of Europe (table 6.8). England was the preferred country for foreign studies, and 43 % of the Danish students chose to go here. 10 % went to Sweden, 9 % to Norway and USA, and 5 % to Germany. At the same time as the number of Danish students taking a full education abroad has fallen, there has been an increase in the number of foreign students taking a complete education in Denmark. In 2005, there were 5,342 foreign students taking an complete Danish higher education. Add to these 224 foreign PhD students. Except for students from the Nordic countries, the majority of the foreign students take study courses that are offered in English (figure 6.5). In 2005, approximately one third more foreign students came to Denmark than there were Danish students abroad to pursue a full education. The greater part of the foreign students came from China (20 %), Norway (17 %), Iceland (11 %), Sweden (10 %), and Germany (5 %). Table 6.8. Danish students taking a complete course of study abroad
Figure 6.5 Foreign students taking a complete course of study in Denmark
6.6 The students incomeIn 2005, 87 % of the 18-29 year olds in nonpaid education received grants from the State Education Grant and Loan Scheme. In addition, 82 % had paid work, while 36 % complemented their income with student loans. 90 % had other income such as interest, child support, and housing benefits. The students may be either paid, partially paid, or non-paid. The paid education programmes include the vocational education and training main courses of study and the social and health care helper education, while the partially paid programmes comprise the social educator and nursing professional bachelor education. The greater part by far of the students are in a non-paid education programme including the upper secondary schools, the vocational trade basic course of study, and most higher education programmes. In this section, only the 18-29 year old students in non-paid education programmes are considered. Table 6.9 shows the proportion of the 18-29 year old students in nonpaid programmes that received the various types of income in the period 2000-2005. In 2005, 91 % of the students received public transfer income. The greater part of these by far (87 %) received grants from the State Education Grant and Loan Scheme, while 7 % received labour market subsidies, 3 % received cash benefits, and 1 % received rehabilitation support. 82 % had work besides studying, while 90 % had other income such as interest, child support, and housing benefits. The number of students with student loans has dropped from 42 % in 2002 to 36 % in 2005. Table 6.10 shows the proportion of the students in higher education that receive grants, earn wages, and take up student loans. Table 6.10 shows the proportion of the students in higher education that receive grants, earn wages, and take up student loans. The proportion receiving grants has been stable since 2000 in the university bachelor education programmes, while the proportion in the rest of the higher education programmes has decreased by three to four percentage points since 2002. Table 6.9. Proportion of 18-29 year old students in a non-paid education who receive the respective income
Table 6.10. Proportion of 18-29 year old students in a non-paid education who receive the respective income
In general, the proportion of students working in addition to studying has been relatively stable since 2000. From 2004 to 2005 however, the proportion in short-cycle higher education increased from 76 % to 80 %. The number of students complementing their income by student loans has fallen since 2002 regardless of education. Although a decreasing proportion of the students take student loans, the average amount that is borrowed has increased irrespective of education programme. For instance, students in a bachelor education borrowed an average of DKK 25,600 in 2005 compared to an average of DKK 21,300 in 2000 (figure 6.6). Since 2000, there has been a general increase in the students average gross income, which is the total income excluding student loans. Students in short-cycle higher education, however, experienced a small decrease from 2000 to 2001, while students in university bachelor and masters programmes (candidatus) experienced a small decrease from 2001 to 2002 (table 6.11). Figure 6.7 shows the percentage development in average gross income compared to the development in the consumer price index. For students in professional bachelor programmes, the increase in average gross income has been above the increase in the consumer price index during the period concerned. On the other hand, the average gross income of students in short-cycle higher education programmes was steady from 2000 to 2002, whereupon it increased until 2005 when it caught up with the consumer price index for the first time during the period concerned. For students in university bachelor education programmes, the average gross income was steady from 2001 to 2003 at which time it again began increasing. The same development is largely observed for students in the twostep masters programmes (candidatus), although in this case there was a decrease from 2001 to 2002. Figure 6.6. Average amount of student loan for 18-29 year old students in non-paid education who receive student loans, current prices DKK
Table 6.11. Average gross income for 18-29 year old students in nonpaid education, current prices DKK
Figure 6.7. Development in the average gross income of 18-29 year old students in non-paid education, index
Footnotes5) Corresponds to a designated duration of three years because the start is usually in September and graduation in May.
7 Time spent from completing the 9th form until achieving vocational qualificationsIn average, the Danes use 4.2 years more than the designated time to complete a vocationally qualifying education after graduating from the 9th form. Frequently, more time is used on obtaining a vocationally qualifying education than is stipulated for the particular course of study. This is because the students can change their choice of study, they can take breaks from the studies, and some choose to take more than one youth education. Table 7.1 shows the total time used by the students to obtain a vocationally qualifying education. The total designated duration of study corresponds to the straight course from 9th form graduation to the completion of a vocationally qualifying education. Designated time for a teachers education is three years in general upper secondary school and four years in a teachers training college, a total of seven years6. This is not the only course to a teachers education; however, it is the most direct one. Furthermore, the additional time used by the students completing the 9th form is shown. The additional time comprises: 1) change of studies, referring to the time used on a course of study not completed, 2) double youth education, meaning the time used on another youth education after having completed one youth education, 3) an education break, referring to the time not used for education, for instance for work, military service, travelling etc., 4) 10th form since the 10th form is optional, and 5) other time, mainly covering an extended time to complete the study programme. In average, a student uses 9.5 years after the 9th form to obtain an education. Of these, 5.3 years are used on the designated time of studies and 4.2 years on additional time. The largest part of the additional time is used on an education break of 2.5 years. In average, change of studies, 10th form, and other time each constitute 0.5 years, and a double youth education adds 0.3 years. The average time used on changing study and on 10th form are practically independent of which education is taken, whilst other types of time used vary depending on education programme. The longest education break is found in vocationally oriented education and training programmes, short-cycle higher education, and professional bachelor education, while the university students take the shortest breaks. In the vocationally oriented education and training programmes, an average of 3.7 years is used on designated time of study. An additional 4.1 years are used on completing the education. A double youth education is naturally most common in the trade programmes because many choose to take a general upper secondary as well as a vocationally oriented education and training. With 3.4 years, the university bachelors have the least extra use of time. Here, the break in education is also the shortest. Note that only students who do not continue in a masters programme (candidatus) are counted here. The majority by far continues in a masters programme (candidatus), and they are therefore counted in that category. With 5.1 years, the masters students (candidatus) have the highest use of extra time. Their break in education is less than average; however, other time, mainly consisting of study delays, being almost two years in average, is much higher than in other education programmes. Figure 7.1 depicts the additional time used by the students to obtain vocational qualifications. Table 7.1. Time spent from completing the 9th form until achieving vocational qualifications
Figure 7.1. Additional time spent by students to attain vocational qualifications, years
Footnotes6) In practice, a little less than seven years because most programmes start in August/September and terminate in June.
8 Adult and continuing educationThe proportion participating in activities within adult and continuing education has gone up. In 2006, more than one in four (26 %) of the Danish labour force in the 25-64 years age group had participated in an adult and continuing education activity (VEU activity) within the last four weeks before the time of the survey. This proportion is slightly higher than in 2004 and 2005, but considerably higher compared to 2003 where the corresponding proportion was 14 % (figure 8.1). Compared to Finland, Norway, and France, the extent of VEU activities is highest in Denmark (table 8.1). The length of adult and continuing education (VEU) varies greatly. In order to obtain a uniform concept, the activity is measured by translating into full-time student years. A student year corresponds to a full-time student during one year. For example, a student year in adult vocational training (AMU) is 1,480 hours per year, while a student year in Danish as a secondary language is 756 hours. From 2003 to 2004, the activity fell by approximately 4,000 student years. Table 8.2 shows two opposite developments: A rise in the activity in higher education (e.g. diploma and masters programmes (candidatus)) and a heavy decrease in the activity within Danish as a secondary language. Figure 8.2 shows the development in graphical form. Figure 8.1. Proportion of the labour force in age group 25-64 who has participated in VEU activities within the last four weeks
Table 8.1. Proportion of the labour force in age group 25-64 in selected EU countries who has participated in VEU activities within the last four weeks
Table 8.2. Student years in public VEU, total and per type of VEU
Figure 8.2. Student years in public VEU, total and per type of VEU
9 ResultsThere are several ways of looking at the education level of the population. Two ways are presented here: By means of tabulations of the achieved level of education of the population and by means of extrapolations of the present behaviour to future populations. These two methods are used for different purposes. Tabulations of the achieved level of education may be used for comparison and status of the present situation. However, when viewing the present populations, often many changes have taken place since they started in the education system. Extrapolations are useful if one desires to learn about the significance of present behaviour for the future. Here, we get a picture of how the future will be if the behaviour that we know today continues. In this chapter, the education level of the population is first illustrated by comparing the education level of the population in Denmark with that of other OECD countries and then by looking at the highest education held by persons in the workforce. These two tabulations build on the education level the population has achieved; however, because of different methods of counting, they are not directly comparable. After the two tabulations, an extrapolation is made of the education level that the current youth cohorts are expected to have in 25 years assuming they educate themselves according to the study behaviour in 2005. 9.1 Proportion with at least a youth education in Denmark and selected countriesAmong the OECD countries, there is a difference in the proportion of the various generations that have received at least a youth education. The generation differences contribute to explaining the development in education level in the various countries. In 2005, 87 % of the 25-34 year olds had at least a youth education, while it was 83 % for the group of 35-44 year olds. As such, 13 % of the 25-34 year olds and 17 % of the 35-44 year olds had no education besides basic school. Among the 45-54 year olds and the 55-64 year olds, 78 % and 75 % respectively, had at least a youth education. This corresponds to 22 % of the 45-54 year olds and 25 % of the 55-64 year olds without an education besides basic school (table 9.1). Because of different methods, the numbers are not directly comparable with the numbers in section 9.2 and 9.3 (see the preface to this chapter). The proportion with at least a youth education is higher than the OECD average for all four age groups. In the OECD countries, 79 % of the 25-34 year olds and 71 % of the 35-44 year olds had at least a youth education. For the group of 45-54 year olds, it was 64 %, while the OECD average for the 55-65 year olds was 54 %. However, as seen from the table, there is a wide variation among the OECD countries. Figure 9.1 shows the percentages with at least a youth education in the different age groups. The countries are listed by decreasing percentage of 25-34 year olds with at least a youth education. Among the 25-34 year olds, Denmark is placed in the upper third together with for instance Korea, Finland and Sweden. The difference between the 25-34 year olds and the 55-64 year olds is generally a little less in the countries where the most 25-34 year olds have at least a youth education. As shown in the figure, Korea stands out with a large difference between the percentages for those two generations with at least a youth education. Table 9.1. Population in Denmark and selected OECD countries that has attained at least upper secondary education, 2005, percentage by age group
Figure 9.1. Population in Denmark and selected OECD countries that has attained at least upper secondary education, 2005, percentage by age group
9.2 The highest completed education in the labour forceThe labour force numbered 2.67 million in 2005. In general, the education level has increased for this group. The labour force is comprised of persons in the 15-69 age group who are either working or jobless. Students who are enrolled in a full-time education programme and who work less than 28 hours per week are not counted in the labour force. In 2005, the labour force numbered 2.67 million persons, corresponding to 70 % of the total population in the 15-69 age group. During the period 2000-2005, there was a decrease of approximately 30,000 in availability in the Danish labour market (table 9.2). For one in four in the labour force, corresponding to 675,900 individuals, basic school is the highest completed education. 39 %, corresponding to 1.04 million, have completed a vocationally oriented education and training, and a proportion of 29 % of the workforce, corresponding to 760,100 individuals, has a higher education. The percentage distribution is illustrated in table 9.2. In general, the education level has increased for the labour force. As in the preceding section, this change is primarily owed to generation differences. The younger year groups in the labour market have a higher education than the year groups who are retiring in these years. From 2000 through 2005, there has been a decrease from 29 % to 25 % in the proportion with basic school as the highest completed education. This corresponds to 93,100 persons. During the same period, the proportion with an upper secondary education has been steady at a good 7 %, while the share with a vocationally oriented education has been 39-40 %. The total share with a higher education has increased from slightly more than 24 % to a little less than 29 %. Figure 9.2 shows the distribution of the labour force by highest completed education. Table 9.2. Labour force (15-69 year olds) by highest completed education
Figure 9.2. The labour force (15-69 year olds) by highest completed education in 2005, percent
9.3 Future youth cohorts81 % of the young people are expected to go through a youth education programme, 76 % of them will obtain vocational qualification, that is to say a vocationally oriented education or a higher education. It is the goal of the government that in 2015, 95 % of a youth cohort achieve a youth education, and that 50 % achieve a higher education. In order to keep track of these goals, it is extrapolated each year which course of study future year groups will take. The extrapolation shows which course of study the new youth cohort will take over the next 25 years after completing the 9th form assuming that the education system and the study behaviour will be as it was in 2005. Figure 9.3 shows the result of the extrapolation of which course of study a youth cohort will follow over 25 years. The figure shows the expected course of a youth cohort through the education system based on a known behaviour in 2005. Nearly 56 % of the students leaving basic school in 2005 are expected to start in upper secondary school, nearly 40 % to start a vocationally oriented education and training programme, and a little less than 5 % will never start an education. That is to say, 95 % are expected to continue in a youth education programme. Slightly more than 81 % will complete a youth education. That is to say, a part drops out on the way. If those persons are included who do not take a youth education but qualify via vocational experience and single subject higher preparatory examination (hf ) and complete a higher education, a good 85 % obtain at least a youth education. Of the total year group, 53 % will receive an upper secondary education and nearly 38 % a vocational education. In both categories, almost 10 % take both educations. Three in four (76 %) end up with a vocationally qualifying education. That is to say, a vocationally oriented education or a higher education as the highest completed education. 33 % are expected to receive a vocationally oriented education. This proportion is split in 8 % in commercial, 17 % in technical, and 8 % in another vocationally oriented education (mainly social and health care). Almost 44 % end up with a higher education of these 6 % with a short-cycle higher education (KVU), 23 % with a medium-cycle higher education (MVU), and 15 % with a long-cycle higher education (LVU). Not everyone receives an education. In total, nearly 15 % end up without any kind of education after basic school, while a good 9 % end up with study qualifications, that is to say primarily an upper secondary education. Table 9.3 and table 9.4 show extrapolations of the youth cohorts in the period from 1990 to 2005, first for a youth education, and then for the highest completed education. It is noted that especially the proportions with an upper secondary education rose significantly until around 1995. Since then, the increase has been less; however, the proportion with a vocationally oriented education has dropped slightly. When considering the final qualifications 25 years after the 9th form, the proportion receiving an education increased strongly during 1990-2000, but then remained steady during the following years (table 9.4). Figure 9.3. Education profile 2005
Table 9.3. Proportion of a youth cohort with a youth education
Table 9.4. Final education qualifications
Facts and Figures 2007 is an outline of the Danish education
system with a quantitative description of trends and developments
in various fields of education.
|
||
|
To the top of the page |