|

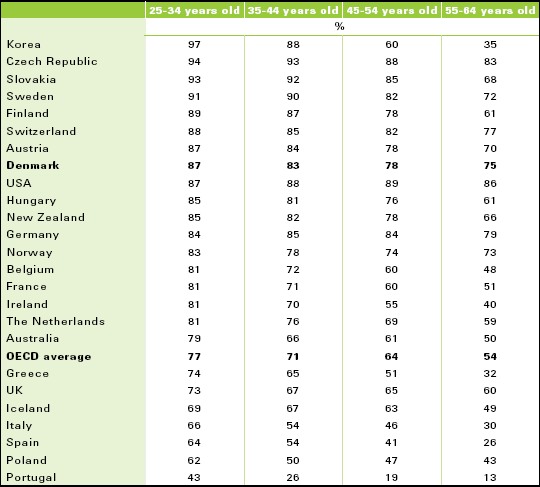
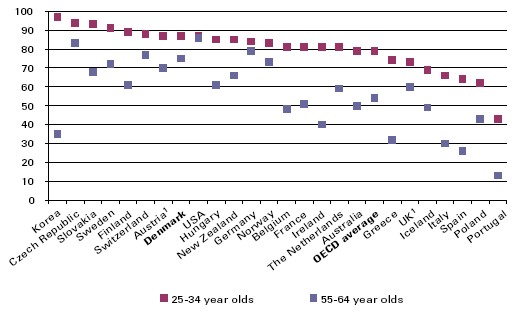
9 ResultsThere are several ways of looking at the education level of the population. Two ways are presented here: By means of tabulations of the achieved level of education of the population and by means of extrapolations of the present behaviour to future populations. These two methods are used for different purposes. Tabulations of the achieved level of education may be used for comparison and status of the present situation. However, when viewing the present populations, often many changes have taken place since they started in the education system. Extrapolations are useful if one desires to learn about the significance of present behaviour for the future. Here, we get a picture of how the future will be if the behaviour that we know today continues. In this chapter, the education level of the population is first illustrated by comparing the education level of the population in Denmark with that of other OECD countries and then by looking at the highest education held by persons in the workforce. These two tabulations build on the education level the population has achieved; however, because of different methods of counting, they are not directly comparable. After the two tabulations, an extrapolation is made of the education level that the current youth cohorts are expected to have in 25 years assuming they educate themselves according to the study behaviour in 2005. 9.1 Proportion with at least a youth education in Denmark and selected countriesAmong the OECD countries, there is a difference in the proportion of the various generations that have received at least a youth education. The generation differences contribute to explaining the development in education level in the various countries. In 2005, 87 % of the 25-34 year olds had at least a youth education, while it was 83 % for the group of 35-44 year olds. As such, 13 % of the 25-34 year olds and 17 % of the 35-44 year olds had no education besides basic school. Among the 45-54 year olds and the 55-64 year olds, 78 % and 75 % respectively, had at least a youth education. This corresponds to 22 % of the 45-54 year olds and 25 % of the 55-64 year olds without an education besides basic school (table 9.1). Because of different methods, the numbers are not directly comparable with the numbers in section 9.2 and 9.3 (see the preface to this chapter). The proportion with at least a youth education is higher than the OECD average for all four age groups. In the OECD countries, 79 % of the 25-34 year olds and 71 % of the 35-44 year olds had at least a youth education. For the group of 45-54 year olds, it was 64 %, while the OECD average for the 55-65 year olds was 54 %. However, as seen from the table, there is a wide variation among the OECD countries. Figure 9.1 shows the percentages with at least a youth education in the different age groups. The countries are listed by decreasing percentage of 25-34 year olds with at least a youth education. Among the 25-34 year olds, Denmark is placed in the upper third together with for instance Korea, Finland and Sweden. The difference between the 25-34 year olds and the 55-64 year olds is generally a little less in the countries where the most 25-34 year olds have at least a youth education. As shown in the figure, Korea stands out with a large difference between the percentages for those two generations with at least a youth education. Table 9.1. Population in Denmark and selected OECD countries that has attained at least upper secondary education, 2005, percentage by age group
Figure 9.1. Population in Denmark and selected OECD countries that has attained at least upper secondary education, 2005, percentage by age group
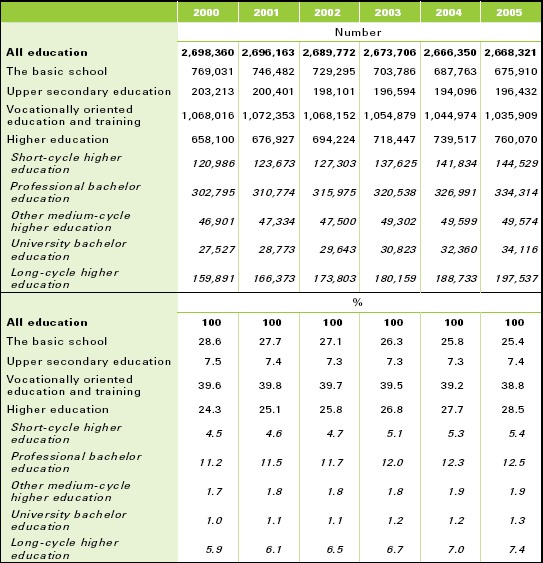
9.2 The highest completed education in the labour forceThe labour force numbered 2.67 million in 2005. In general, the education level has increased for this group. The labour force is comprised of persons in the 15-69 age group who are either working or jobless. Students who are enrolled in a full-time education programme and who work less than 28 hours per week are not counted in the labour force. In 2005, the labour force numbered 2.67 million persons, corresponding to 70 % of the total population in the 15-69 age group. During the period 2000-2005, there was a decrease of approximately 30,000 in availability in the Danish labour market (table 9.2). For one in four in the labour force, corresponding to 675,900 individuals, basic school is the highest completed education. 39 %, corresponding to 1.04 million, have completed a vocationally oriented education and training, and a proportion of 29 % of the workforce, corresponding to 760,100 individuals, has a higher education. The percentage distribution is illustrated in table 9.2. In general, the education level has increased for the labour force. As in the preceding section, this change is primarily owed to generation differences. The younger year groups in the labour market have a higher education than the year groups who are retiring in these years. From 2000 through 2005, there has been a decrease from 29 % to 25 % in the proportion with basic school as the highest completed education. This corresponds to 93,100 persons. During the same period, the proportion with an upper secondary education has been steady at a good 7 %, while the share with a vocationally oriented education has been 39-40 %. The total share with a higher education has increased from slightly more than 24 % to a little less than 29 %. Figure 9.2 shows the distribution of the labour force by highest completed education. Table 9.2. Labour force (15-69 year olds) by highest completed education
Figure 9.2. The labour force (15-69 year olds) by highest completed education in 2005, percent
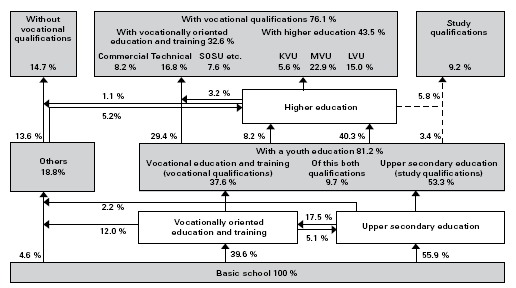
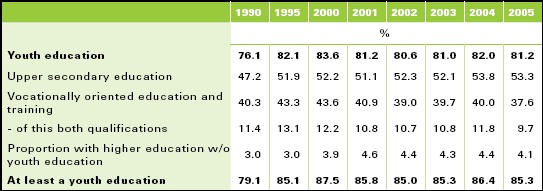
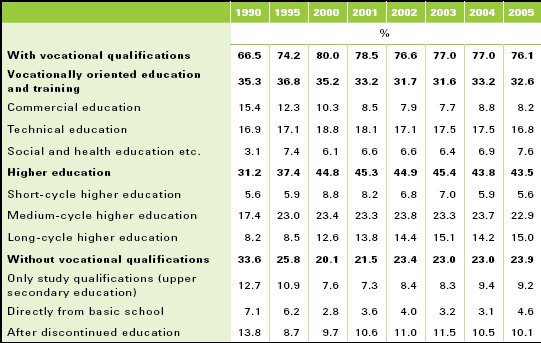
9.3 Future youth cohorts81 % of the young people are expected to go through a youth education programme, 76 % of them will obtain vocational qualification, that is to say a vocationally oriented education or a higher education. It is the goal of the government that in 2015, 95 % of a youth cohort achieve a youth education, and that 50 % achieve a higher education. In order to keep track of these goals, it is extrapolated each year which course of study future year groups will take. The extrapolation shows which course of study the new youth cohort will take over the next 25 years after completing the 9th form assuming that the education system and the study behaviour will be as it was in 2005. Figure 9.3 shows the result of the extrapolation of which course of study a youth cohort will follow over 25 years. The figure shows the expected course of a youth cohort through the education system based on a known behaviour in 2005. Nearly 56 % of the students leaving basic school in 2005 are expected to start in upper secondary school, nearly 40 % to start a vocationally oriented education and training programme, and a little less than 5 % will never start an education. That is to say, 95 % are expected to continue in a youth education programme. Slightly more than 81 % will complete a youth education. That is to say, a part drops out on the way. If those persons are included who do not take a youth education but qualify via vocational experience and single subject higher preparatory examination (hf ) and complete a higher education, a good 85 % obtain at least a youth education. Of the total year group, 53 % will receive an upper secondary education and nearly 38 % a vocational education. In both categories, almost 10 % take both educations. Three in four (76 %) end up with a vocationally qualifying education. That is to say, a vocationally oriented education or a higher education as the highest completed education. 33 % are expected to receive a vocationally oriented education. This proportion is split in 8 % in commercial, 17 % in technical, and 8 % in another vocationally oriented education (mainly social and health care). Almost 44 % end up with a higher education of these 6 % with a short-cycle higher education (KVU), 23 % with a medium-cycle higher education (MVU), and 15 % with a long-cycle higher education (LVU). Not everyone receives an education. In total, nearly 15 % end up without any kind of education after basic school, while a good 9 % end up with study qualifications, that is to say primarily an upper secondary education. Table 9.3 and table 9.4 show extrapolations of the youth cohorts in the period from 1990 to 2005, first for a youth education, and then for the highest completed education. It is noted that especially the proportions with an upper secondary education rose significantly until around 1995. Since then, the increase has been less; however, the proportion with a vocationally oriented education has dropped slightly. When considering the final qualifications 25 years after the 9th form, the proportion receiving an education increased strongly during 1990-2000, but then remained steady during the following years (table 9.4). Figure 9.3. Education profile 2005
Table 9.3. Proportion of a youth cohort with a youth education
Table 9.4. Final education qualifications
Facts and Figures 2007 is an outline of the Danish education
system with a quantitative description of trends and developments
in various fields of education.
|
||
|
To the top of the page |